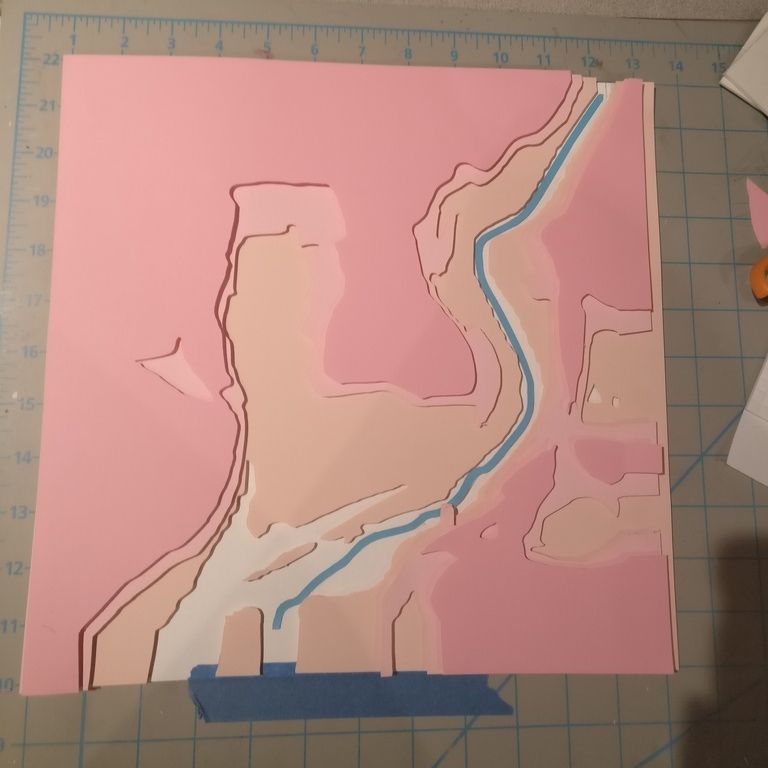
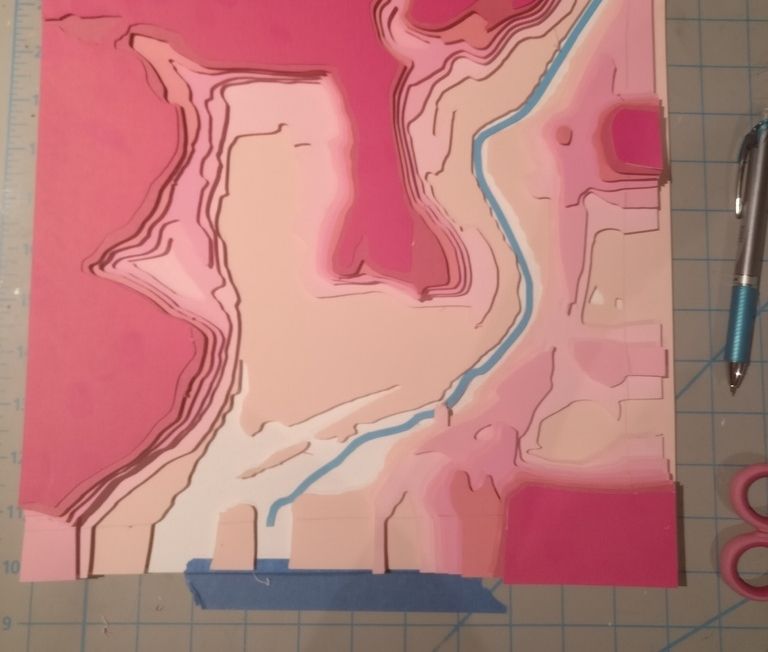
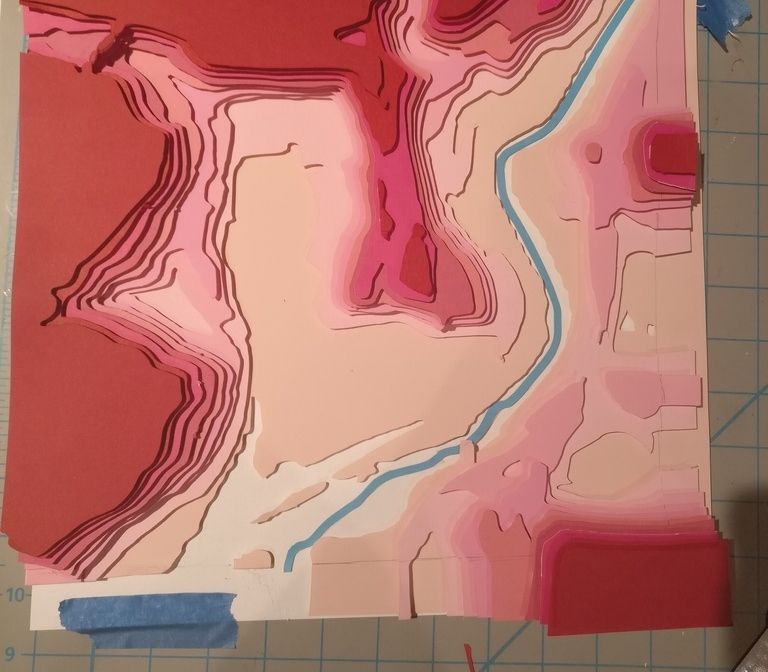
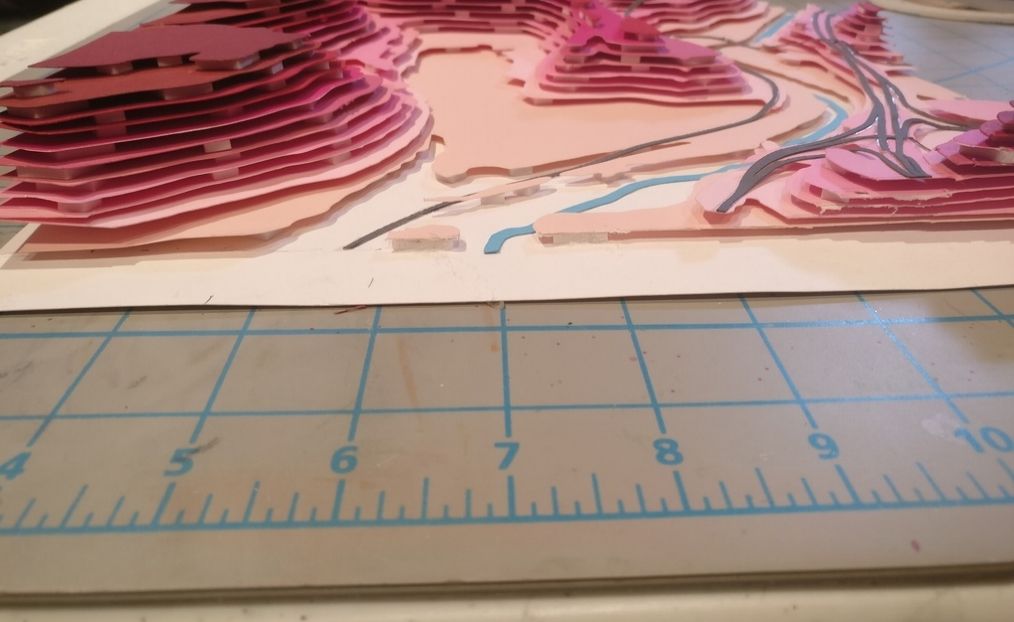
by Scott Mackey, Geovis Project Assignment @RyersonGeo, SA8905, Fall 2016
Since its first iteration in 1984 with Charles Hull’s Stereo Lithography, the process of additive manufacturing has made substantial technological bounds (Ishengoma, 2014). With advances in both capability and cost effectiveness, 3D printing has recently grown immensely in popularity and practicality. Sites like Thingiverse and Tinkercad allow anyone with access to a 3D printer (which are becoming more and more affordable) to create tangible models of anything and everything.
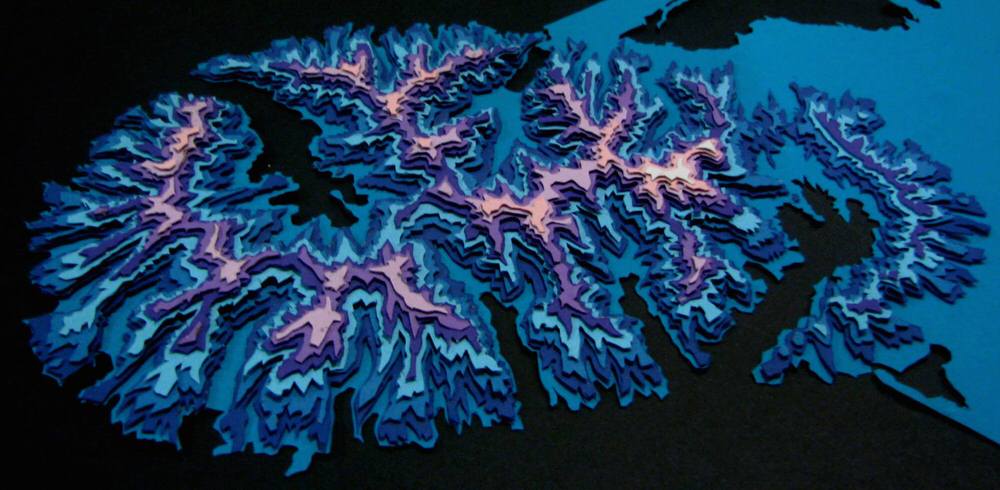
When I discovered the 3D printers at Ryerson’s Digital Media Experience (DME) lab, I decided to 3D print models of interesting Canadian topographies, selecting study areas from the east coast (Nova Scotia), west coast (Alberta), and central Canada (southern Ontario). These locations show the range of topographies and land types strewn across Canada, and the models can provide practical use alongside their aesthetic allure by identifying key features throughout the different elevations of the scene.
The first step in this process was to learn how to 3D print. The DME has three different 3D printers, all of which use an additive layering process. An additive process melts materials and applies them thin layer by thin layer to create a final physical product. A variety of materials can be used in additive layers, including plastic filaments such as polylactic acid (PLA) (plastic filament) and Acrylonitrile Butadiene Styrene (ABS), or nylon filaments. After a brief tutorial at the DME on the 3D printing process, I chose to use their Lulzbot TAZ, the 3D printer offering the largest surface area. The TAZ is compatible with ABS or PLA filament of a 1.75 mm diameter. I decided on white PLA filament as it offers a smooth finish and melts at a lower temperature, with the white colour being easy to paint over.

The next step was to acquire the data in the necessary format. The TAZ requires the digital 3D model to be in an STL (STereoLithography) format. Two websites were paramount in the creation of my STL files. The first was GeoGratis Geospatial Data Extraction. This National Resources Canada site provides free geospatial data extraction, allowing the user to select elevation (DSM or DEM) and land use attribute data in an area of Canada. The process of downloading the data was quick and painless, and soon I had detailed geospatial information on the sites I was modelling.

One challenge still remained despite having elevation and land use data – creating an STL file. While researching how to do this, I came across the open source web tool called Terrain2STL on a visualization website called jthatch.com. This tool allows the user to select an area on a Google basemap, and then extracts the elevation data of that area from the Consortium for Spatial Information’s SRTM 90m Digital Elevation Database, originally produced by NASA. Terrain2STL allows the users to increase the vertical scaling (up to four times) in order to exaggerate elevation, lower the height of sea level for emphasis, and raise the base height of the produced model in a selected area ranging in size from a few city blocks to an entire national park.
The first area I selected was Charleston Lake in southern Ontario. Being a southern part of the Canadian Shield, this lake was created by glaciers scarring the Earth’s surface. The vertical scaling was set to four, as the scene does not have much elevation change.
Once I downloaded the STL, I brought the file into Windows 10’s 3D Builder application to slim down the base of the model. The 3D modelling program Cura was then used to further exaggerated the vertical scaling to 6 times, and to upload the model to the TAZ. Once the filament was loaded and the printer heated, it was ready to print. This first model took around 5 hours, and fortunately went flawlessly.
Cape Breton, Nova Scotia was selected for the east coast model. While this site has a bit more elevation change than Charleston Lake, it still needed to have 4 times vertical exaggeration to show the site’s elevations. This print took roughly 4 and a half hours.
Finally, I selected Banff, Alberta as my final scene. This area shows the entrance to Banff National Park from Calgary. No vertical scaling was needed for this area. This print took roughly 5 and half hours.
Once all the models were successfully printed, it was time to add some visual emphasis. This was done by painting each model with acrylic paint, using lighter green shades for high areas to darker green shades for areas of low elevation, and blue for water. The data extracted from GeoGratis was used as a reference in is process. Although I explored the idea of including delineations of trails, trail heads, roads, railways, and other features, I decided they would make the models too busy. However, future iterations of such 3D models could be designed to show specific land uses and features for more practical purposes.


3D models are a fun and appealing way to visual topographies. There is something inexplicably satisfying about holding a tangible representation of the Earth, and the applicability of 3D geographic models for analysis should not be overlooked.
Sources:
GeoGratis Geospatial Data Extraction. (n.d.). Retrieved November 28, 2016, from http://www.geogratis.gc.ca/site/eng/extraction
Ishengoma, F. R., & Mtaho, A. B. (2014). 3D Printing: Developing Countries Perspectives. International Journal of Computer Applications, 104(11), 30-34. doi:10.5120/18249-9329
Terrain2STL Create STL models of the surface of Earth. (n.d.). Retrieved November 28, 2016, from http://jthatch.com/Terrain2STL/
