By Nicole Serrafero
Geovis Project Assignment @RyersonGeo, SA8905, Fall 2016
When learning about geography in the early years of school we had to trace and label contours based off topographic maps. For the purpose of the course work I decided to take inspiration from my younger school days and use modern technologies to attempt to reproduce a topographic map with cartographic elements included. My main inspiration came from an artist by the name of Sam Cadwell who creates beautiful works of arts using layers of paper to represent contours. An example of his work can be seen below and through the link to his website.
The project involved cutting out each contour layer and features using a Cricut machine which is computer guided paper cutter (seen below).

The maximum paper size that the cutter program can handle is 11” in x 11” so I ensured that the study area would fit within the paper size limitations. The paper used for the project was 12”x12” cardstock paper in a variety of colours to represent each feature. For the layers of contours, a pink to red colour scheme was used as it provided me with up to 15 layers of sequential colours.

The water features were blue, the rail features yellow, the buildings a light purple, and the roads black.
Data Used
Four (4) datasets were used to produce the topographic model:
- Contour Lines (Obtained from TRCA)
- Building Footprints (Obtained from DMTI spatial)
- Waterways (Obtained from TRCA)
- Road and Rail Lines (Obtained from Statistics Canada)
Study Area Extraction
All of the files were loaded into ArcMap then all projected to WGS84 to ensure all files were in the same projection. The Evergreen Brick Works was chosen as the study area as its surrounding area contains interesting contours, roads, a major highway, railways, a river. To ensure that the study area was contained within the paper limitations the page size within ArcMap was set to 11” x 11” and the map view was adjusted until I was satisfied with the area. Once the final study area was chosen the features within the view were clipped out and saved as separate files. Below is a screen shot of what the final study area covers.

With the data now clipped the further data processing could be done easily as the amount of data was significantly reduced. The contour lines came as 1m intervals with a range of 22 individual contours levels which is too many levels for the amount of paper that I have available for the contours. The number of contours was reduced by selecting every 4 m contour then extracting the selected lines to a separate file. With the new file the number of layers was reduced to 12 layers which fits within my 15-layer limit. The remaining files did not need further processing within ArcMap.
The next major step to get the files ready for the paper cutter. To do this all layers were saved as scalable vector files (SVG) for each data set. To accomplish this all layers were turned off except for one dataset. Then the Export Map option was used to save the map area as an SVG file. The SVG files were then imported into a program called Inskscape to be edited further. Within the Inskscape program the contours were divided up into their individual 4m interval layers (seen below).

Some of the smaller contour lines were deleted as the cutter would not be able to cut the shape out. The other features were given a layer of their own as well. Each individual layer was then exported and saved as an 11”x11” page in JPEG format. The program used to work the paper cutter did not work as well with files that came from ArcMap directly which was why Inkscape was used. It is also easier to edit/select the lines and change the thickness within Inkscape.
Printing and Assembling the Model
To cut our each layer the JPEG layers were imported into the paper cutter program. Each layer was placed on the canvas then the corresponding colour was placed on the cutting map and loaded into the machine. Once loaded the paper cutter proceeded with cutting the paper. An example of what a cut layer from the machine can be seen below.

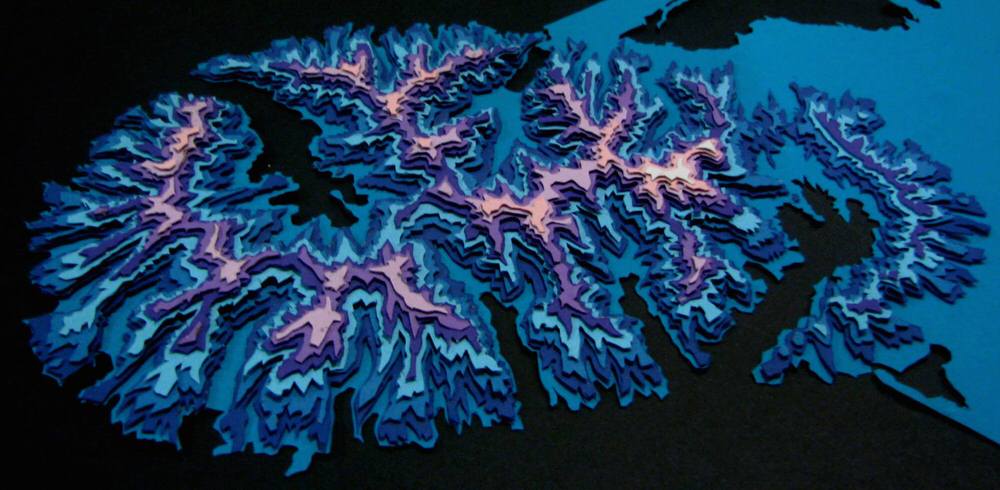
The contours were cut first followed by the river, then the roads and railway and last was the Evergreeen Brick Works buildings. Each contour layer was stuck together using foam spacers that had tape on each size. These spacers were used to create the illusion of height in the model. The remaining paper features were stuck on using double sided tape. The following images show the assembling process.


Once all of the paper layer were assembled the legend, scale, north arrow, and labels were added by hand. The final product can be seen below.
