By: Garrett Holmes | SA8903 – Fall 2024
The Madawaska is a river and provincial park located in the Central Ottawa watershed in Southern Ontario.
The section of river inside the Madawaska Provincial Park is a popular camping and water-sport location for paddlers across the province. The river includes numerous sets of rapids that present a fun and exciting challenge for paddlers. However, as the water level and discharge rates fluctuate throughout the year from rainfall, snowmelt, and other factors, the conditions of the white water rapids change, so it’s important for paddlers to understand what state the river is in in order to prepare for a trip. My web app will visually symbolize what these different water levels mean for paddlers at different times of the year, while providing other information about rapids, campsite, and access points.
The final web app repository can be viewed here
Requirements
Creating a React App
Install React
Follow this tutorial to create a basic ReactJS app, call it ‘map-app’ and navigate to it in a text editor like VSCode. You will notice a few important files and folders in here. ‘README.md’ includes some information and important commands for your app. The ‘public’ folder includes any files that you’ll want to access in your app, like images or metadata. This is where you will put your GIS data once we have the react app assembled.
React is designed to be modular and organized, and essentially lets us manipulate HTML components using javascript. A react app is made up of components, which are sections of code that are modular and re-usable. Components also have props and states. Props are passed into a component and can represent things like text, style options, files, and more to change the look and behaviour of components. Hooks are functions that allow us to change the state of a component on the fly, and are what makes react interactive and mutable.
Setting up OpenLayers
Before we start our react app, install OpenLayers, a library that allows us to easily display and work with geographic vector data with javascript and html, which can therefore be used with react. Run the command “npm install ol" to install OpenLayers.
Now that we have a react app set up and OpenLayers, we can start our react app with npm start. This will open a page in your default browser that links to the local server on your machine that’s running your application.
Making a base map
Now lets make a component for our map. Right click on the ‘src’ folder in the left pane and click ‘New Folder’, we will call it ‘Components’. Now right click on that folder and click ‘New File’, call it ‘BaseMap.js’. If you have the extension ‘ES7+ React/Redux/React-Native snippets’ installed – in the extensions tab on the left – you can go to your new file and type ‘rfce’ then press enter to create the basic shell of a component with the same name as the filename. Otherwise you can copy the code below into your ‘MapLayer.js’ file:
import React from 'react'

function BaseMap() {
  return (
    <div>BaseMap</div>
  )
}

export default BaseMap
Now lets populate the component with everything we need from OpenLayers. We will create a map that displays open street map, an open source basemap. I won’t explain everything about how react works since it would take too long, but see the [OpenLayers guide])(https://openlayers.org/doc/tutorials/concepts.html) for details on what each of the components are doing. This should be your component once you have added everything:
import React, { useEffect, useState } from 'react'

// Import the necessary components from OpenLayers
import { Map, View } from 'ol'
import TileLayer from 'ol/layer/Tile'
import { OSM } from 'ol/source'

function BaseMap() {
    const [map, setMap] = useState(null); // Store the map instance

    // Use effect will make sure that the map is continuously rendered every time it changes
    useEffect(() => {

        // Create a map instance
        const olMap = new Map({
            layers: [
                new TileLayer({
                    source: new OSM()
                })
            ],
            view: new View({
                center: [0, 0],
                zoom: 2
            }),
            controls: [],
            target: 'map',
        });

        // Store the map and vector source instances
        setMap(olMap);

        return () => {
            olMap.setTarget(null); // Cleanup on unmount
        };

    }, []);

    return (
        // Return a <div> item with style set so that it covers the entire screen
        <div>
            <div id="map" style={{ width: "100vw", height: "100vh" }} />
        </div>
    )
}

export default BaseMap
This will fill the entire page with the Open Street Map basemap. To render our component on the page, navigate to ‘App.js’ and delete all the default items inside the <div> in the return statement. At the top of the page import our BaseMap component: import BaseMap from './Components/BaseMap';. Then, add the component inside the <div> in the return statement.
function App() {
  return (
    <div className="App">
      <BaseMap/>
    </div>
  );
}
Hit ctrl+s to save, and you should see your map on the webpage! You will be able to zoon and navigate the same as if it were google maps.
Adding vector data to the map
Now, let’s create a generalized component that we can use to add vector data to the web app. OpenLayers is capable of supporting a variety of filetypes for displaying vector data, but for now we’ll use GeoJSON because of it’s widespread compatibility.
Inside the ‘Components’ folder, create a new file called ‘MapLayers.js’, then use rfce to populate the component, or copy the following code:
import React from 'react'

function MapLayers() {
  return (
    <div>MapLayers1</div>
  )
}

export default MapLayers
In React, components communicate with eachother using ‘props’. We’ll use these to add our layers.
Add a ‘layers’ prop and a ‘map’ prop to the component definition:
function MapLayers({ layers, map })
Now we can access the data that’s passed into the component. Layers will represent a list of objects containing the filenames for our data as well as symbology information. Map will be the same map we created in the ‘BaseMap’ component.
For react to run code, we need to use a function called a useEffect, that will run automatically when the props that we specify are changed. Inside this function is where we will load the vector data into the ‘map’ prop.
 // Use effect will make sure that the map is continuously rendered every time it changes
    useEffect(() => {
        // Error checking
        if (!map || !layers || layers.length === 0) return;

        const vectorLayers = []

        // Create a layer for each geojson and add it to the map
        layers.forEach((geojson) => {

            const vectorSource = new VectorSource({
                url: geojson.filename,
                format: new GeoJSON()
            })

            const vectorLayer = new VectorLayer({
                source: vectorSource,
                opacity: 1,
                zIndex: geojson.zIndex ? geojson.zIndex : 2,
                style: geojson.style
            })

            vectorLayers.push(vectorLayer);
            map.addLayer(vectorLayer);

        });

        return () => {
            // Cleanup on unmount
            layers.forEach((layer) => map.removeLayer(layer));
        };

    }, [map, layers]);
Since the ‘layers’ prop is a list of object, we can iterate through it with the ‘forEach’ command. For every layer in the list, we’ll make a new VectorSource, which is an OpenLayers object that keeps track of geometry information. We’ll then add each VectorSource to a VectorLayer, which keeps track of how we display the geometry. Finally, the loop adds each new layer to the map. The list at the very bottom of the ‘useEffect()’ tells the program to run the contained code every time the ‘map’ or ‘layers’ props change.
For now, our component will return ‘null’, because everything is going to be rendered on the map in the BaseMap component.
Here’s what your final ‘MapLayers’ component should look like:
import { useEffect } from 'react'

// Import the necessary components from OpenLayers
import VectorLayer from 'ol/layer/Vector'
import VectorSource from 'ol/source/Vector'
import GeoJSON from 'ol/format/GeoJSON.js';

function MapLayers({ layers, map }) {

    // Use effect will make sure that the map is continuously rendered every time it changes
    useEffect(() => {
        // Error checking
        if (!map || !layers || layers.length === 0) return;

        const vectorLayers = []

        // Create a layer for each geojson and add it to the map
        layers.forEach((geojson) => {

            const vectorSource = new VectorSource({
                url: geojson.filename,
                format: new GeoJSON()
            })

            const vectorLayer = new VectorLayer({
                source: vectorSource,
                opacity: 1,
// Ternary operator, if the layer has a zIndex use it, otherwise default 2
                zIndex: geojson.zIndex ? geojson.zIndex : 2,
                style: geojson.style
            })

            vectorLayers.push(vectorLayer);
            map.addLayer(vectorLayer);

        });

        return () => {
            layers.forEach((layer) => map.removeLayer(layer)); // Cleanup on unmount
        };

    }, [map, layers]);

    return null
}

export default MapLayers
Adding Data
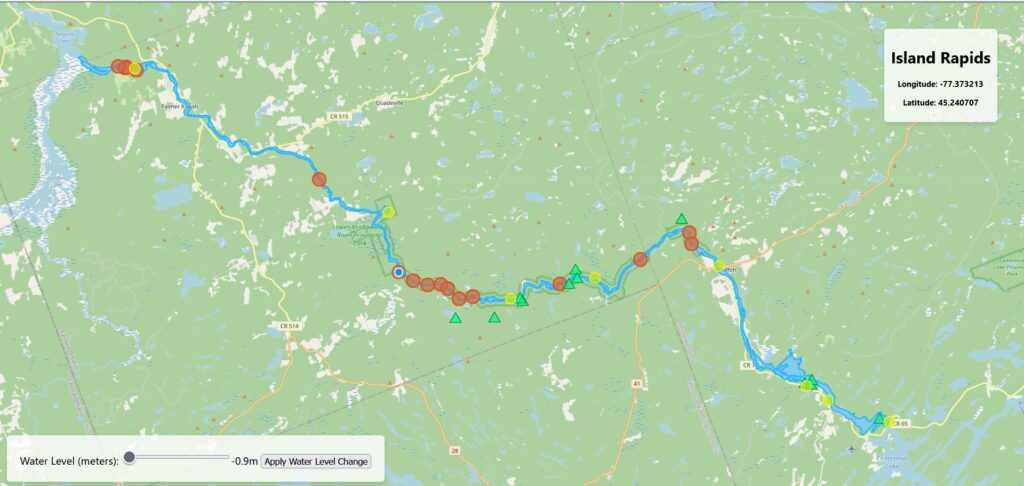
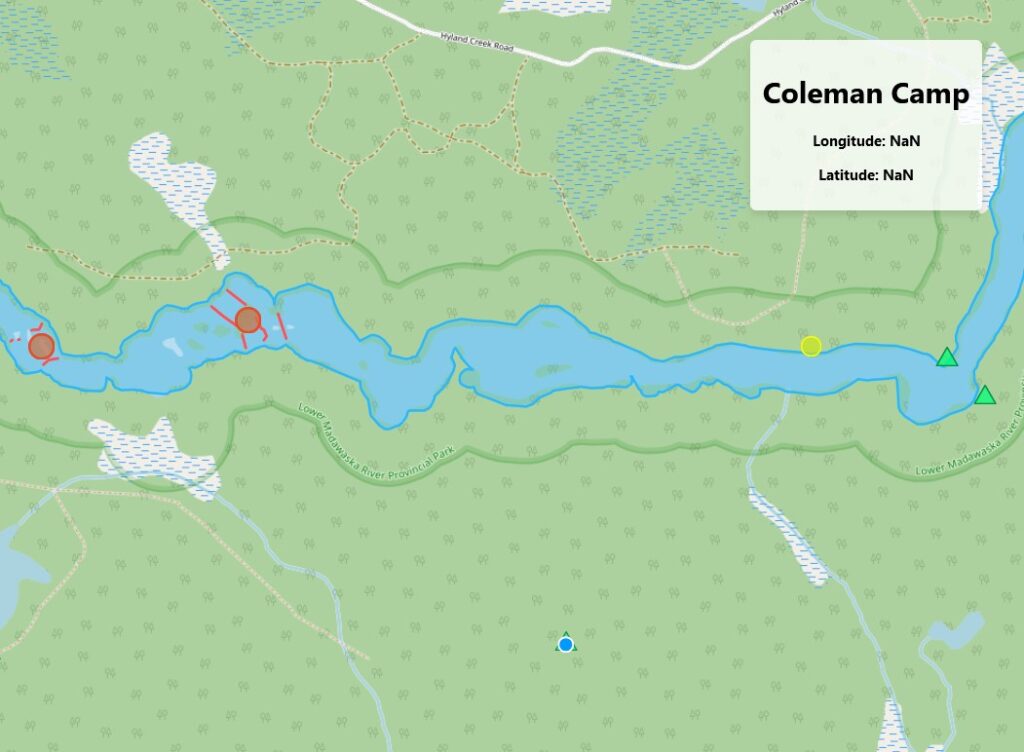
A map with nothing on it is no use to anyone. For this project, the goal was to build a web tool for looking at how the water level affects the rivers edge in the Madawaska River Provincial Park in Ontario.
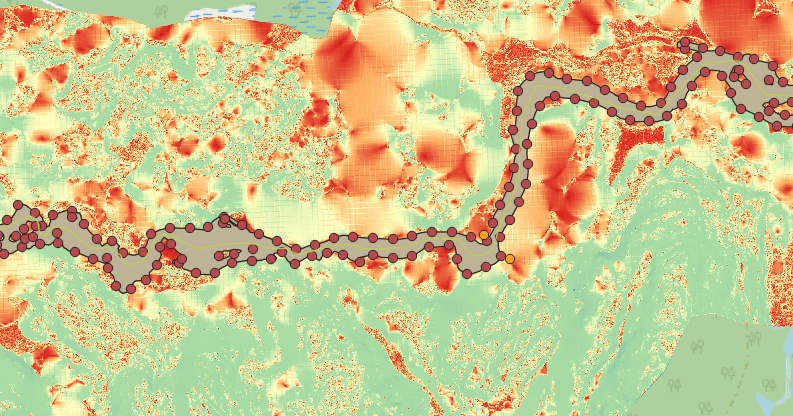
In order to represent the elevation of the river and calculate metrics at different locations along the river, I used the Ontario Imagery-Derived DEM which is offered at a 2m resolution. The Madawaska river is located in two sections; DRAPE B, and DRAPE C. Since these are very large files image files, I needed to convert each file to tif format and generate pyramids for display in Arc or QGIS.
Then, I downloadd the Ontario Hydrographic Line dataset to get the locations of rapids and other features like dams.
I also needed shape data to represent the river itself from the Ontario Open Data portal.
Then, I loaded the ‘.vrt’ file I made from the DEM images into QGIS, and clipped it by the extent of the river polygon. I chose to clip the raster to a buffer of 1km to leave room to represent the surrounding area as well.
Preparing the data
Then, I had to format the data properly to be used in the web app.
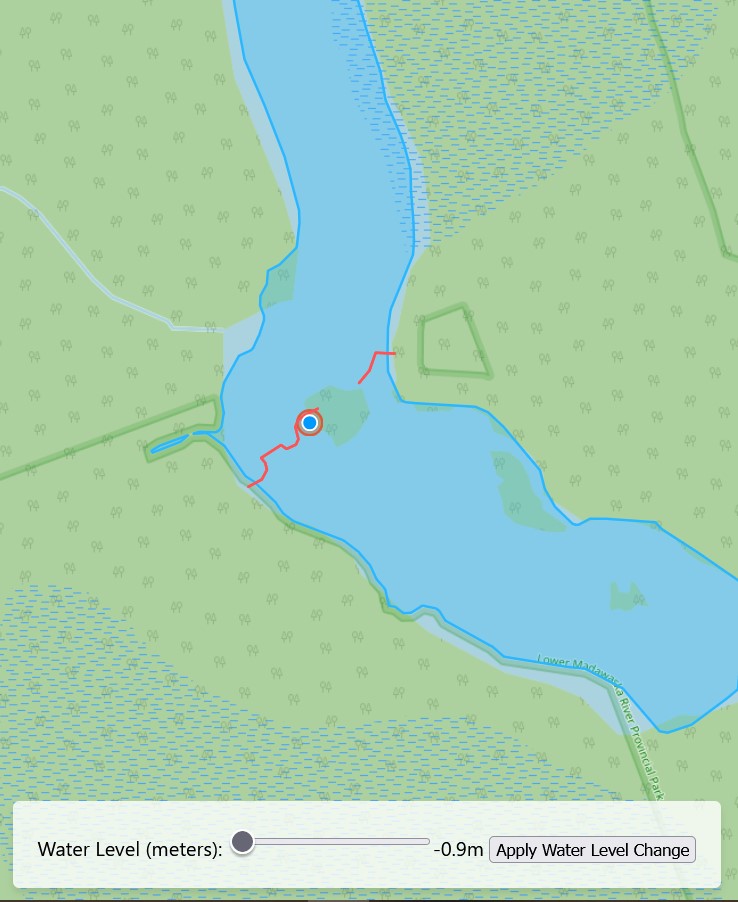
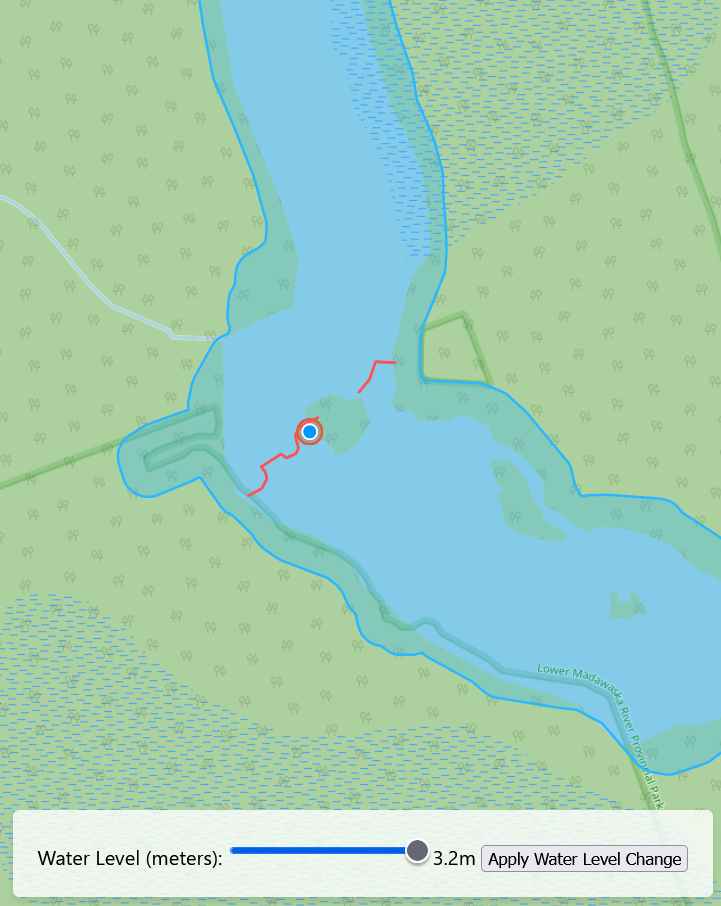
When the water level of a river rises, the width of the river expands, and the bank recedes up the shore. I represented the change in water level by adding a dynamic buffer to the river polygon as an approximation of water level rise. It should be noted that this approximation assumes that the water has risen uniformly across the course of the river, which could not be true, however for the purpose of simplifying the app I used that assumption. The actual distance on land that the river expands to at any given section will depend on the slope of the embankment. This is where the DEM comes into play. I calculated the buffer distance to be applied to the river based on sampled points representing the slope along the river’s edge. Then I used the average slope to come up with the buffer distance per water level rise.
To keep things simple, and since the slope of the river bank does not vary much over its course, we will use the average slope along the edge of the river as our Slope value.
To do this, I used the following QGIS tools:
- Polygon to Lines (Madawaska River)
- Points Along Geometry (Madawaska River Lines, for every 50m)
- Sample Raster Values (Slope)
- Field Calculator: mean(“SAMPLE_1”) = 9.6%
Here’s the equation for calculating buffer distance:
Buffer Distance = water level change / tan(Slope)
(Where slope is represented as a percentage)
The tangent of the slope here represents the ratio of the water level rise to the distance it will travel over land. Therefore the constant we’ll divide the water level change with will be tan(slope) = 0.17
Before adding my shape data to the map, I had to do a fair amount of cleaning in QGIS. First, every layer is clipped to be within 1km of the river. All the rapids were named manually based on topographic maps, then Aggregated by their name. I also generated a file containing the centroids for each set of rapids for easier interpretation on the map.
Campsite and Access Point data was taken from the Recreation Point dataset by the Ministry of Natural Resources. Campsites and Access points were split into separate layers for easier symbolization.
Each file was then exported from QGIS as a GeoJSON file, then saved in the ‘public’ folder of my react app under ‘layers’. This will make it possible to access the layers from the code.
Adding the data to the web app
Now that all the data is ready, we can put all the pieces together. Inside ‘BaseMap.js’, create a new list at the top of the page called ‘jsonLayers’. Each item in the list will have the following format:
{
  filename: "layers/layerfilename.geojson",
  style: new Style(),
  zIndex: #
}
Where the filename is the path to your GeoJSON layer, the style is an OpenLayers Style instance (which I won’t explain here, but you can learn more from the OpenLayers documentation), and zIndex represents which layers will appear on top of others (For example, zIndex = 1 is below zIndex = 10).
Next, at the bottom of the component where we ‘return’ what to display, we will add an instance of our ‘MapLayers’ component, and pass in the required props.
return (
        // Return a <div> item with style set so that it covers the entire screen
        <div>
            <div id="map" style={{ width: "100vw", height: "100vh" }} />
            {map && (<MapLayers map={map} layers={jsonLayers} />)}
        </div>
    )
Now in your web app, you should see your layers on screen! You may need to zoom in to find them.
I added a few other features and tools that make it so that the map automatically zooms to the extent of the largest layer, and so that the user can select features to see their name.
Geo-visualization
Once the basic structure of the app was set up, I could start to add extra features to represent the water level change. I created a new component called ‘BufferLayer’, which takes in a single GeoJSON file as well as a map to display the vector on. This component makes use of a library called turf.js that allows you to perform geospatial operations in javascript. I used turf.js to apply the buffer described above using a function that takes the geometry from the VectorSource for the layer, and directly applies a turf.js buffer operation to it. The buffer is always applied to the ‘original’ river polygon, meaning that a 10m buffer won’t ‘stack’ on top of another 10m buffer. This also prevents issues with broken geometry caused by the buffer operation when applying a negative buffer.
To control my buffer, I created one more component called ‘LevelSlider’, which adds a simple slider and a button that when pressed, runs the ‘handleBufferChange` function. The math for calculating the buffer distance based on the slope is done in the LevelSlider component with the static values I calculated earlier. The minimum and maximum values are also customizable. Here’s a snippet of that component:
 // Only send the value on button click to prevent performance issues
    const handleButtonClick = () => {
        onChange(Number(sliderValue) / tanSlope); // Send value to parent on button click
    };

    return (
        <div style={{ padding: '10px', textAlign: 'center' }}>
            <label htmlFor="buffer-slider">Water Level (meters): </label>
            <input
                id="buffer-slider"
                type="range"
                min={min}
                max={max}
                step={step}
                value={sliderValue}
                onChange={handleSliderChange}
            />
            <span>{sliderValue}m</span>
            <span>{'\t'}</span>
            <button onClick={handleButtonClick}>Apply Water Level Change</button>
        </div>
    )
The LevelSlider component is added in the ‘return’ section of ‘BufferLayer’, with CSS styling to make sure it appears neatly in the bottom left corner of the map.
return (
  <div style={{ styles }}>
    <LevelSlider min={-0.9} max={3.2} initialValue={-0.9} step={0.1} onChange={handleBufferChange} />
  </div>
)
The example minimum and maximum values are based on the minimum and maximum water level changes (from average) in the river based on real hydro-metric data from Environment Canada.
Conclusion
With a bit of extra styling, and by making use of other OpenLayers features like ‘Select’, and ‘Overlay’, I was able to build this functional, portable web app that can be added to any react website with ease.
However, lots more can be done to improve it! A chart that tracks hydro-metric data over time could help give context to the water levels on the river. With a little more math, you could even make use of discharge information to estimate the speed of the river at different times of year.
Using the campsite data and a centreline of the river course, you could calculate the distance between campsite, rapids, access points, etc. Making the tool a functional for planning trips. Also, given more information about individual whitewater sets, such as classes (C2, C3, etc.), descriptions, or images you could better represent the river in all it’s detail.