Xingyu Zeng
Geovisual Project Assignment @RyersonGeo, SA8905, Fall 2022
Introduction
3D visualization is an essential and popular category in geovisualization. After a period of development, 3D printing technology has become readily available in people’s daily lives. As a result, 3D printable geovisualization project was relatively easy to implement at the individual level. Also, compared to electronic 3D models, the advantages of explaining physical 3D printed models are obvious when targeting non-professional users.
Data and Softwares
- Data Source: Open Topography – Global Multi-Resolution Topography (GMRT) Data Synthesis
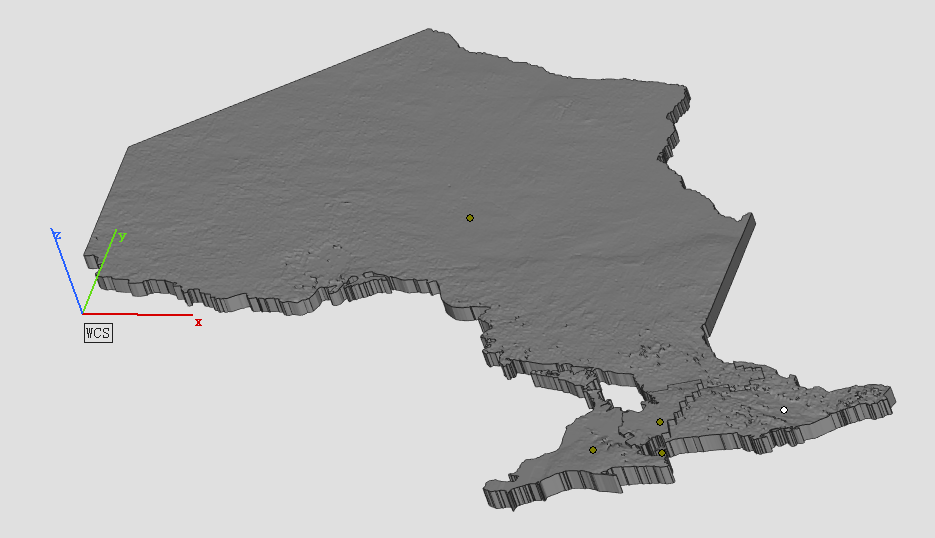
- DEM Data to a 3D Surface: AccuTrans 3D – which provides translation of 3D geometry between the formats used by many 3D modeling programs.
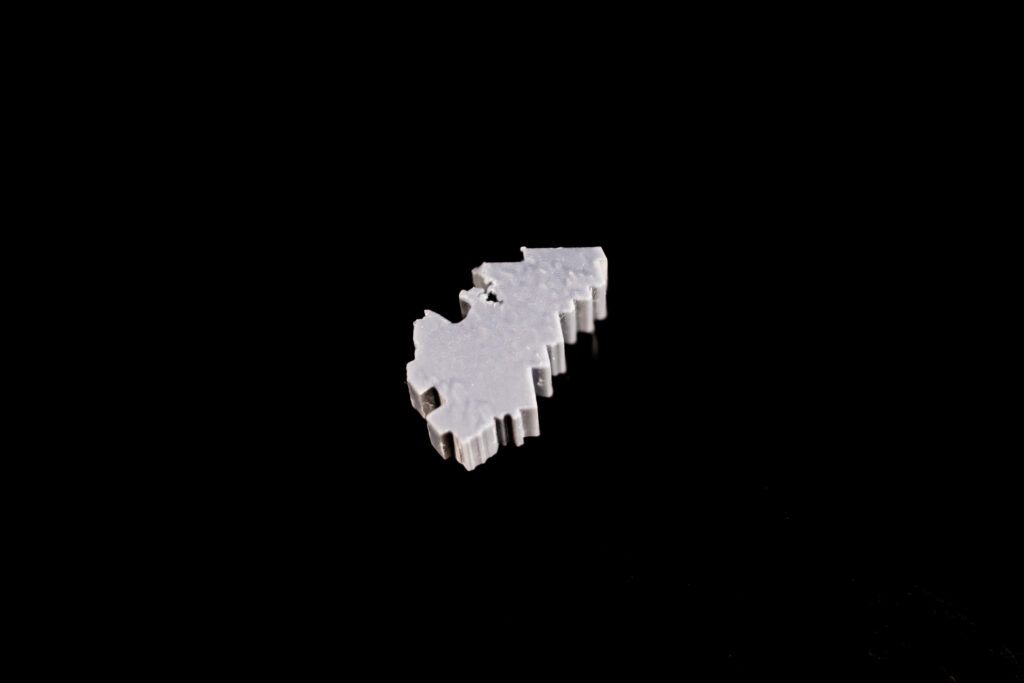
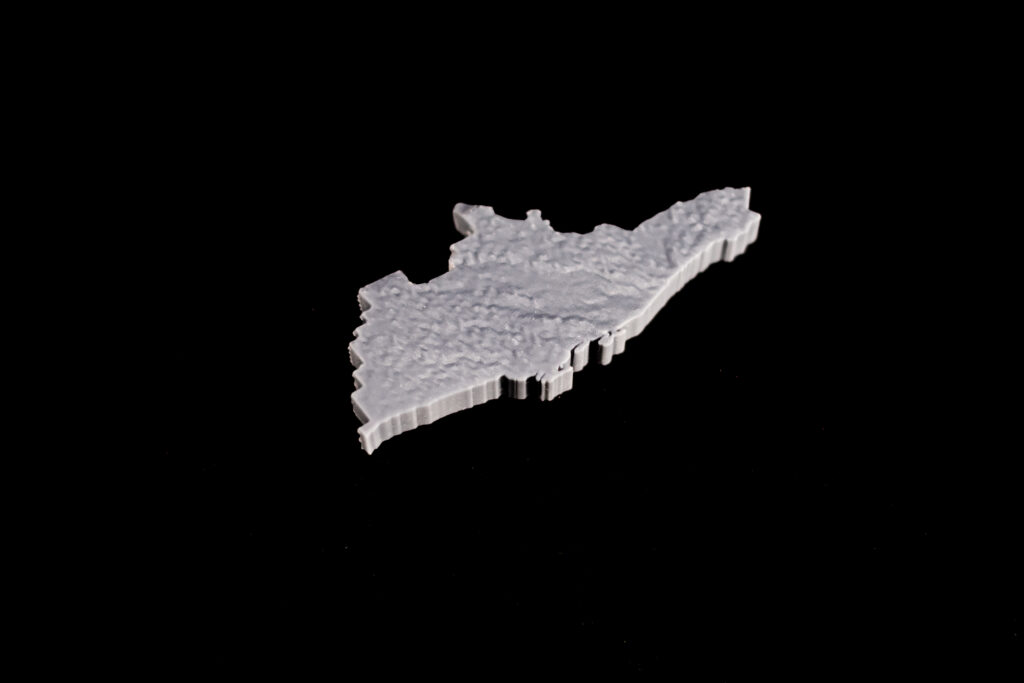
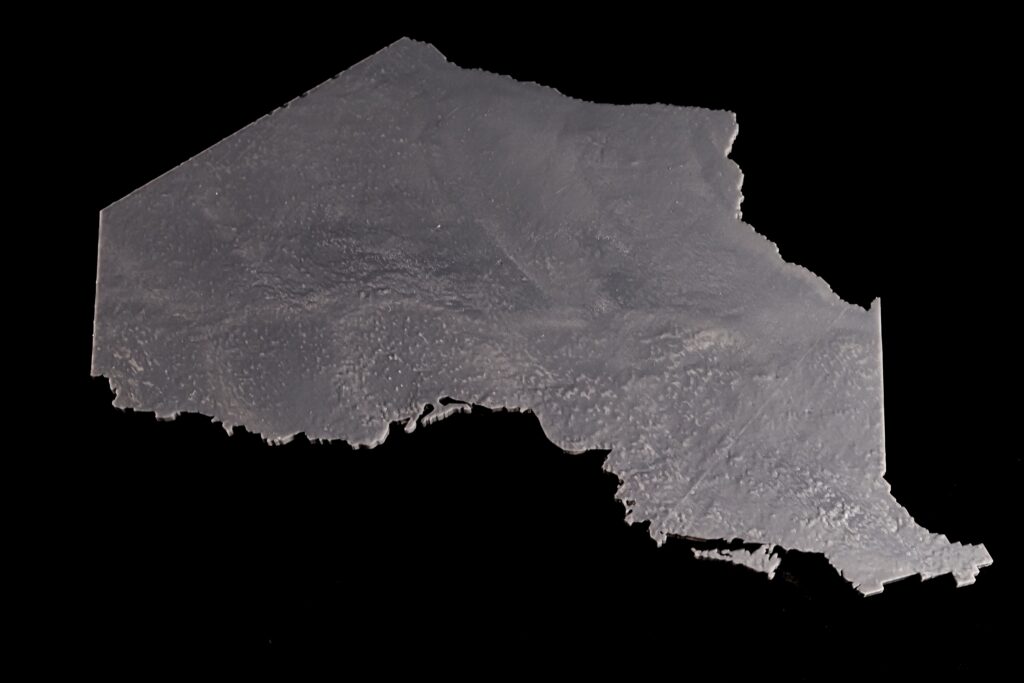
- Converting a 3D Surface to a Solid: Materialise Magics – Converting surface to a solid with thickness and the model is cut according to the boundaries of the 5 Transitional Regions of Ontario. Using different thicknesses representing the differences in total population between Transitional Regions. (e.g. The central region has a population of 5 million, and the thickness is 10 mm; the west region has a population of 4 million the thickness is 8 mm)
- Slicing & Printing: This step is an indispensable step for 3D printing, but because of the wide variety of printer brands on the market, most of them have their own slicing software developed by the manufacturers, so the specific operation process varies. But there is one thing in common, after this step, the file will be transferred to the 3D printer, and what follows is a long wait.
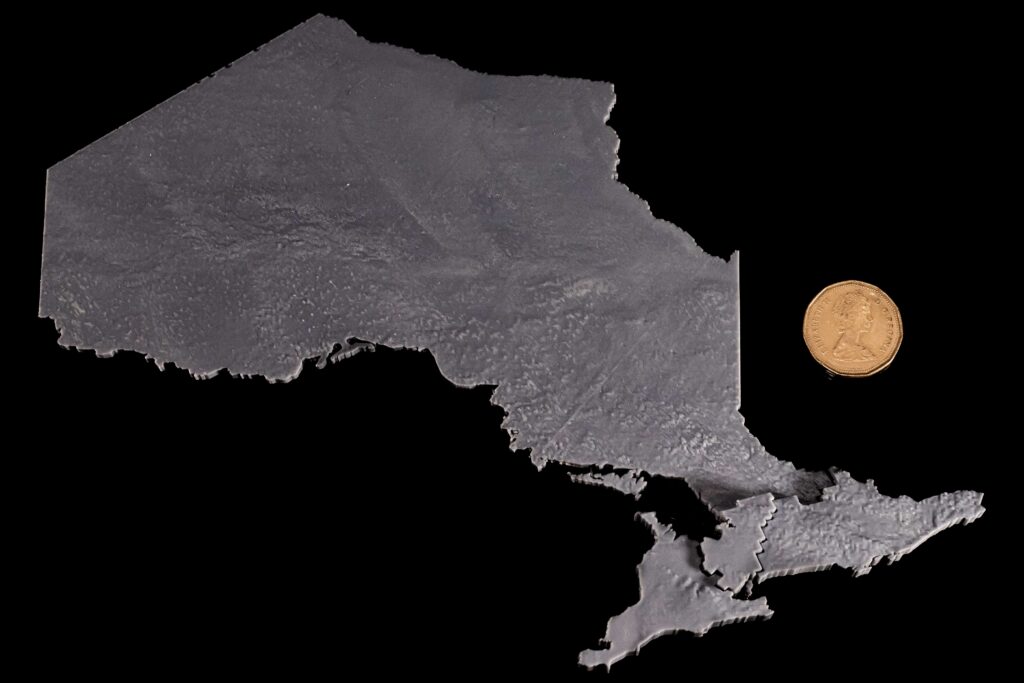
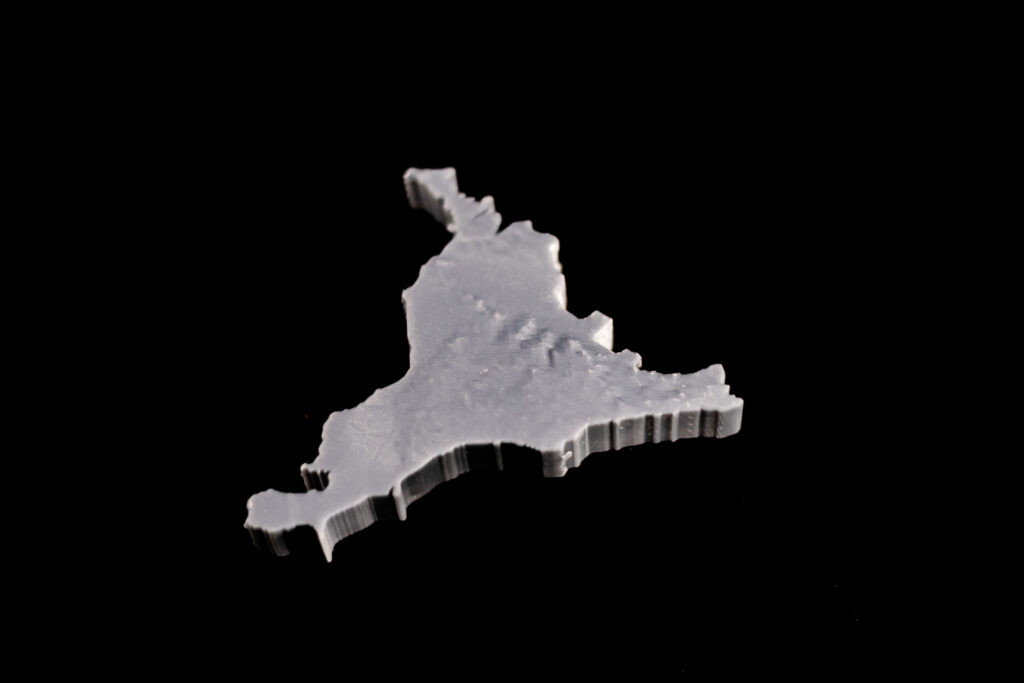
Visualization
The 5 Transitional Regions is reorganized by the 14 Local Health Integration Network (LHIN), and the corresponding population and model heights (thicknesses) for each of the five regions of Ontario are:
- West, clustering of: Erie-St. Clair, South West, Hamilton Niagara Haldimand Brant, Waterloo Wellington, has a total population of about 4 million, the thickness is 8mm.
- Central, clustering of: Mississauga Halton, Central West, Central, North Simcoe Muskoka, has a total population of about 5 million, the thickness is 10mm.
- Toronto, clustering of: Toronto Central, has a total population of about 1.4 million, the thickness is 2.8mm.
- East, clustering of: Central East, South East, Champlain, has a total population of about 3.7 million, the thickness is 7.4mm.
- North, clustering of: North West, North East, has a total population of about 1.6 million, the thickness is 3.2mm.


Limitations
The most unavoidable limitation of 3D printing is the accuracy of the printer itself. It is not only about the mechanical performance of the printer, but also about the materials used, the operating environment (temperature, UV intensity) and other external factors. The result of these factors is that the printed models do not match exactly, even though they are accurate on the computer. On the other hand, the 3D printed terrain can only represent variables that can be presented by unique values, such as the total population of my choice.