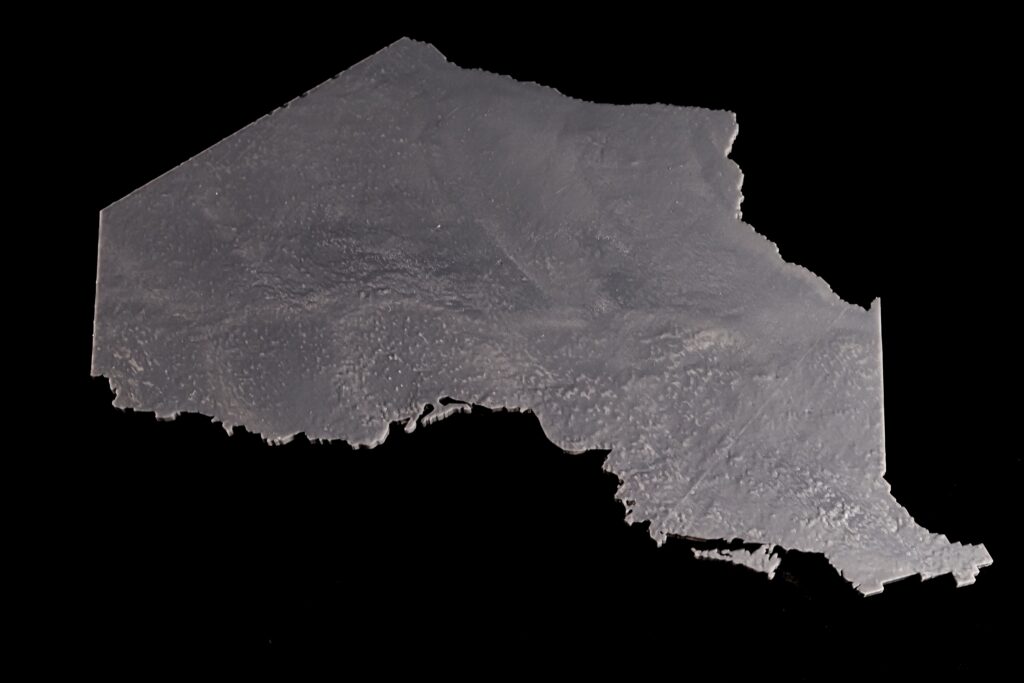
Visualizing Population on a 3D-Printed Terrain of Ontario

Xingyu Zeng

Geovisual Project Assignment @RyersonGeo, SA8905, Fall 2022

Introduction

3D visualization is an essential and popular category in geovisualization. After a period of development, 3D printing technology has become readily available in people’s daily lives. As a result, 3D printable geovisualization project was relatively easy to implement at the individual level. Also, compared to electronic 3D models, the advantages of explaining physical 3D printed models are obvious when targeting non-professional users.

Data and Softwares

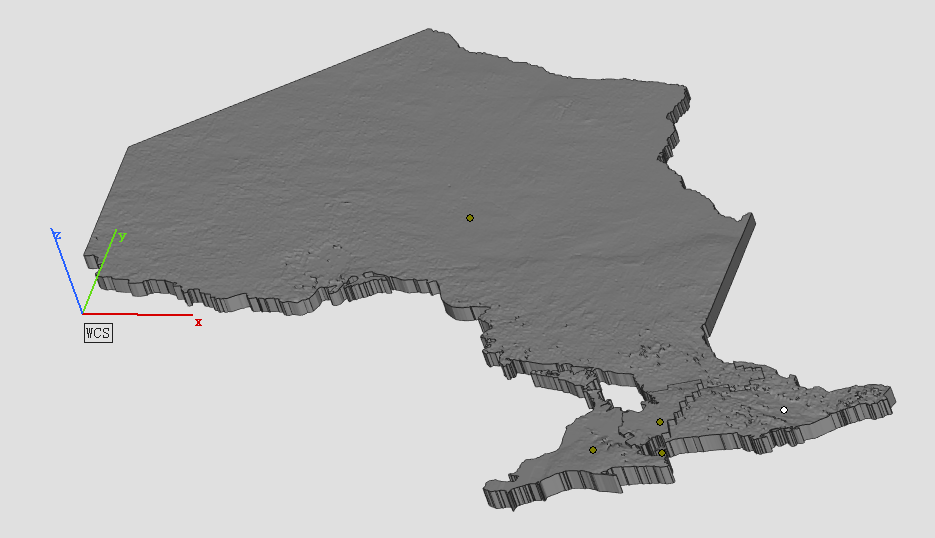
3D model in Materialise Magics
  • Data Source: Open Topography – Global Multi-Resolution Topography (GMRT) Data Synthesis
  • DEM Data to a 3D Surface: AccuTrans 3D – which provides translation of 3D geometry between the formats used by many 3D modeling programs.
  • Converting a 3D Surface to a Solid: Materialise Magics – Converting surface to a solid with thickness and the model is cut according to the boundaries of the 5 Transitional Regions of Ontario. Using different thicknesses representing the differences in total population between Transitional Regions. (e.g. The central region has a population of 5 million, and the thickness is 10 mm; the west region has a population of 4 million the thickness is 8 mm)
  • Slicing & Printing: This step is an indispensable step for 3D printing, but because of the wide variety of printer brands on the market, most of them have their own slicing software developed by the manufacturers, so the specific operation process varies. But there is one thing in common, after this step, the file will be transferred to the 3D printer, and what follows is a long wait.

Visualization

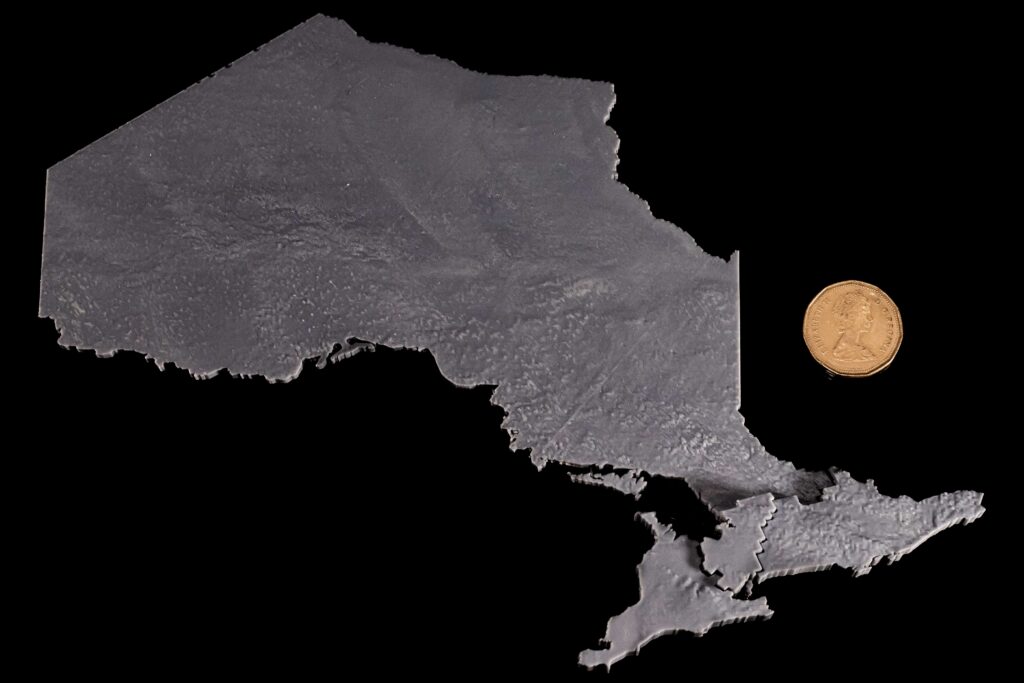
The 5 Transitional Regions is reorganized by the 14 Local Health Integration Network (LHIN), and the corresponding population and model heights (thicknesses) for each of the five regions of Ontario are:

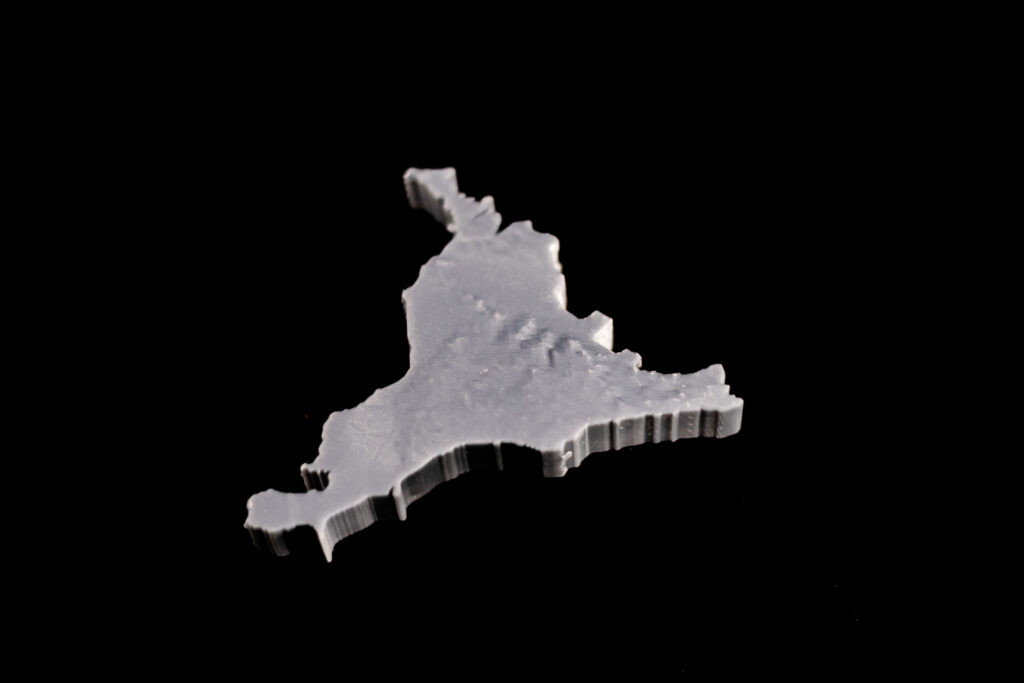
  • West, clustering of: Erie-St. Clair, South West, Hamilton Niagara Haldimand Brant, Waterloo Wellington, has a total population of about 4 million, the thickness is 8mm.
  • Central, clustering of: Mississauga Halton, Central West, Central, North Simcoe Muskoka, has a total population of about 5 million, the thickness is 10mm.
  • Toronto, clustering of: Toronto Central, has a total population of about 1.4 million, the thickness is 2.8mm.
  • East, clustering of: Central East, South East, Champlain, has a total population of about 3.7 million, the thickness is 7.4mm.
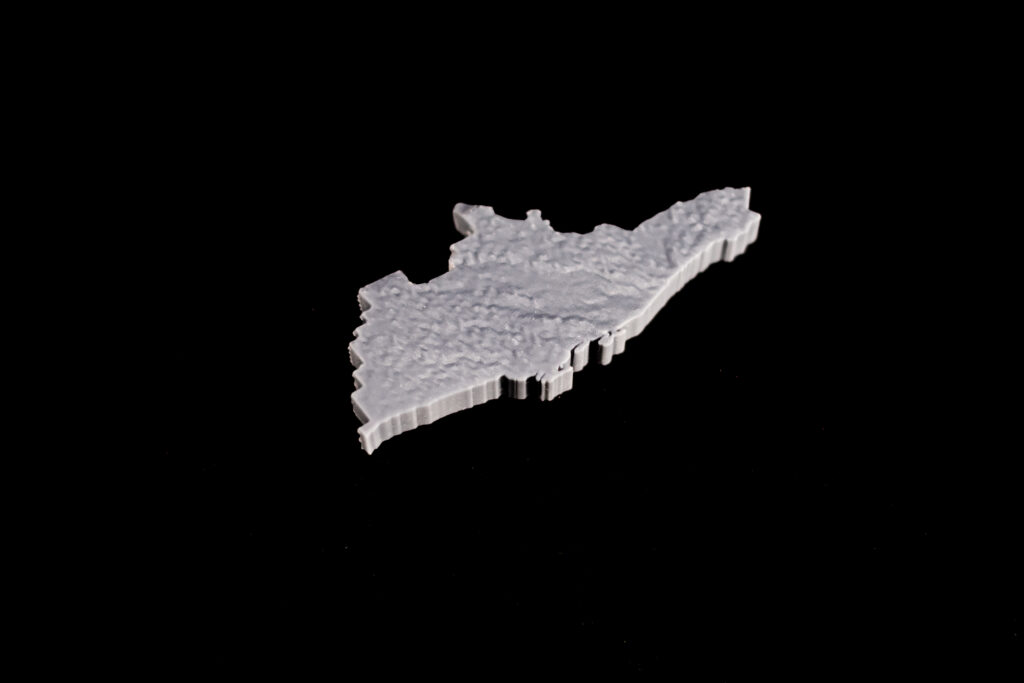
  • North, clustering of: North West, North East, has a total population of about 1.6 million, the thickness is 3.2mm.
Different thicknesses
Dimension Comparison
West region
Central region
Toronto
East region
North region

Limitations

The most unavoidable limitation of 3D printing is the accuracy of the printer itself. It is not only about the mechanical performance of the printer, but also about the materials used, the operating environment (temperature, UV intensity) and other external factors. The result of these factors is that the printed models do not match exactly, even though they are accurate on the computer. On the other hand, the 3D printed terrain can only represent variables that can be presented by unique values, such as the total population of my choice.

Where to Grow?

Assessing urban agriculture potentiality in the City of Edmonton

By Yichun Du
Geovisualization Project, @RyersonGeo, SA8905, Fall 2020

Background

North America is one of the most urbanized areas in the world, according to the United Nations, there are about 82% of the population living in the cities today. It brings various issues, one of them is the sustainability of food supply. Currently, the foods we consume are usually shipped domestically and internationally. Only a few of them are locally supplied. It is neither sustainable nor environmentally-friendly, as a large amount of energy is burned through the logistics of the food supply chain. In order to address this issue, many cities are introducing and encouraging urban agriculture to citizens. 

Urban agriculture is usually summarized as food production activities occurred in urban areas (Colasanti et al. 2012). Zezza & Tasciotti (2010) identified that urban farming and related sectors have employment of around 200 million workforces, and it provides food products to more than 800 million residents. Also, urban agriculture can bring benefits to the city in the aspects of economics, social, citizen health, and ecology. Besides, implementing urban agriculture can help the city to reinvent itself in an attracting,  sustainable, and liveable way. 

The City of Edmonton is North America’s northernmost city (at about 52.5° N) with a population of 0.932 million (2016 Census). However, apart from some very general municipal strategies (a general vision for food and urban agriculture in The Way We Grow MDP, and a more detailed document fresh: Edmonton’s Food & Urban Agriculture Strategy introduced in 2012), there is very little study on the urban agriculture suitability for the City of Edmonton. which gives the incentive to develop this study. The Geo-Visualization of the outcome can inform Edmontonians where to sow the seeds, and also tell them that the place they live has great potential in growing food.

Concept

Edmonton is located on the Canadian Prairie, which leads to very minor topographic changes in the city, but very cold and snowy winters. It limits food production in snow-free seasons, but provides flat ground for agriculture. To conduct an assessment of urban agriculture potentiality for the city, I focused on two themes: ground and rooftop

The ground part is for assessing the potentiality of food production directly taking place on the ground, including the backyard of a house. The general concept is to utilize the existing land-use that supports urban agriculture activities, however, it should be far away from pollution, and to avoid negative externalities. That is to say, current agriculture zoning, parkland, and vacant lots are favoured. Top-up on that, soil nutrient level will be taken into consideration. Then, the constraints will be the close distance to the source of pollution. Meanwhile, urban agriculture activities can bring potential contaminations, such as water pollutants to the water bodies. So the activity should be at a distance to water bodies. 

The rooftop part is for assessing places such as the rooftop of a large building, balconies of a suite in a condo building, or any other places in an artificial structure. The goal of implementing urban agriculture at rooftops is to encourage people to participate, and to focus on proximity to markets, which is people’s dining tables. However, pollution from the surrounding environment should be avoided. 

The project will present the scores at the neighbourhood level in both themes of Ground and Rooftop that shows the potentiality of urban agriculture in the City of Edmonton. 

Data Source

Based on the general concepts mentioned above, the following data are chosen for conducting the analysis. Majority of the data are retrieved from the City of Edmonton’s Open Data Portal. The waterbody shapefile is obtained from the Boundary files at Stats Canada’s 2016 Census. 

Methodology

The preliminary part of this project is done at ArcMap. Then, the visualization part is proceeded using Tableau

The general methodology can be summarized in the following workflows. The first workflow below is for the Ground potentiality. Majority of the work was done on ArcMap. After that, the final results were brought to Tableau for Geo-Visualization with the Rooftop part. The blue boxes are for presenting the original shapefiles. The Yellow boxes are for the Data Criteria. The pink boxes are displaying the secondary shapefiles that are constraints, the green boxes are showing the potential areas or the final results. Both of the pink and green boxes are generated through the white boxes (geoprocessing steps). The final results are processed with data normalization, and an average score was given. So the total score in one neighbourhood was normalized by the total area.

Workflow for the Ground theme.

The second part is the Rooftop potentiality. It has a similar process of the Ground part in getting the results.

Workflow for the Rooftop theme.

Also, a table for the weighting scheme of all the selected criteria is shown below. Constraints are assigned with a negative value, while potentials are assigned positive values. Also, the weights will be heavier for more constraints or potentials.

Weight Assignment Scheme.

Results

Larger the number, higher the potential for conducting urban agriculture. The Ground has a maximum score of 3.8, while Rooftop has a maximum score of 4 in this analysis. 

The results of the scatter plot below suggest that the majority of the neighbourhoods in Edmonton have the potential for urban agriculture. For the Ground theme, only a few of the industrial zones have a score of 0. All types of neighbourhoods are widespread in the score classes. However, the River valley System tends to be associated with medium to high scores. For the Rooftop theme, more than half of the neighbourhoods are in medium to high scores (>2) for the potentiality. Nearly all the mature neighbourhoods are associated with scores higher than 3. Only a few transportation and developing land-uses are having scores of 0.

Scatterplot for scores of Ground and Rooftop potentiality at neighbourhood level.

The next screenshot is the final output from the Tableau Dashboard. Audiences can click on any of the elements that represent a neighbourhood for an excluded view of that specific neighbourhood. For example, you can click one neighbourhood on the Ground map, then the same neighbourhood will be highlighted in the Rooftop map, as well as the point representing that neighbourhood in the scatterplot will be zoomed in with the corresponding score in the two themes. On the other hand, the Audience can select the point in the scatterplot, and the neighbourhood will be zoomed in in the two maps. Also, the audience can view the typology of the neighbourhood and figure out the associated scores for each typology of the neighbourhood by selecting the typology in the legend. Then, all the neighbourhoods belong to that typology will be displayed in the three views. 

Tableau provides an interactive visualization of the urban agriculture potentiality in Edmonton at the neighbourhood level. Please click here for viewing the project.

Dashboard view from Tableau for the final output.

For example, I clicked Oliver neighborhood for Ground score (1.270), then the associated Rooftop score (2.010) and the detailed location of Oliver Neighbourhood is shown in the Rooftop view. Also, the scatterplot for both scores is provided below, with the neighbourhood typology of Central Core.

Example of selecting Oliver neighbourhood.

Limitation

There are some limitations regarding this project’s data source and methodology. If I have access to updated soil nutrition data, solar radiation data, precipitation data that related to the Ground theme, then I would have a better assessment model for a more ideal result regarding the potentiality of the Ground. Also, an inventory of the physical surface details can help to determine where the impermeable surfaces are. Similarly, if I have a comprehensive dataset of rooftop types, including the slope of the roofs and the individual use of the building, could help to eliminate the unsuitable roofs. Moreover, detailed zoning shapefile with potential land-use modification of community gardens, or backyard gardens would be beneficial to the future application of this project. As for the methodology improvement, the major concern is the weight assignments. Opinions from local experts or the authority can help to improve the model to fit the local context. Also, public consultation or survey can bring the general public to the project, which can form a bottom-up approach in transforming Edmonton into an urban agriculture-friendly place. As an expectation for the future development of this Geo-Visualization project, I would like to see more inputs in data source, as well as participation from the general public and local authorities. 

To sum up, this assessment of urban agriculture potentiality in the City of Edmonton assigns all the neighbourhoods scores for Ground and Rooftop potentiality. With those scores, a perception is provided to Edmontonians on where to sow the seeds on the ground, and which neighbourhoods are in the best locations for urban agriculture. 

Reference

Colasanti KJA, Hamm MW, Litjens CM. 2012. The City as an “Agricultural Powerhouse”? Perspectives on Expanding Urban Agriculture from Detroit, Michigan. Urban Geography. 33(3):348–369. doi:10.2747/0272-3638.33.3.348

Zezza A, Tasciotti L. 2010. Urban agriculture, poverty, and food security: Empirical evidence from a sample of developing countries. Food Policy. 35(4):265–273. doi:10.1016/j.foodpol.2010.04.007

A Glimpse of Short Term Rentals in Calgary Using Tableau

by Bryan Willis
Geovis Project Assignment @RyersonGeo, SA8905, Fall 2020

Project linkhttps://thebryanwillis.github.io/CalgaryShortTermRentals.html

Background

Over the years, many homeowners have decided to turn their place of residence into short term rentals, allowing their place of residence to be rented out for short periods of time. Short term rentals have also seen an increase in popularity due to their better pricing when compared with hotels and the unique neighbourhood characteristics it provides. Although Calgary has not seen the increase of short term rentals as dramatics as that of Toronto and Vancouver, Calgary has continued to see growth in the short term rental supply. The City of Calgary defines a short term rental as a place of residence that provides temporary accommodation and lodging for up to 30 days and all short term rentals in Calgary must legally obtain a business license to run.

This interactive dashboard will aim to highlight some key components related to short term rentals in Calgary such as the locations, the license status, the composition of the housing type and licenses per month

Data

The data used in this dashboard is based off of the Short Term Rentals data set which was acquired through the City of Calgary’s Open Data Portal.

Methods

  1. Data Cleaning – After downloading the data from the open data portal, the data needed to be cleaned for it to properly display the attributes we want. All rows containing NULL values were removed from the data set via MS Excel.
  2. Map Production – After importing the cleaned data into Tableau, we should quickly be able to create our map that shows where the locations of the short term rentals are. To do this, drag both the auto generated into the middle of the sheet which should automatically generate a map with the location points. To differentiate LICENSED and CANCELLED points, drag the License Status column into the ‘Color’ box.
  1. Monthly Line Graph – To produce the line graph that shows the number of licenses produced by month, drag into the COLUMN section at the top and right click on it and select MONTH. For the ROWS section, again use but right click on it after dragging and select MEASURE and COUNT. Lastly, drag License Status into the ‘Color’ box.
Finalized monthly line graph
  1. City Quadrant Table – To create this table, we first need to create a new column value for the city quadrant. Right click the white space under ‘Tables’ and click on ‘Create Calculated Field’ which will bring up a new window. In the new window input RIGHT([Address],2) into the blank space. This code will create a new field with the last two letters in the Address field which is the quadrant. Once this field is created, drag it into the ROW section and drag it again into the ROW but this time right clicking it and clicking on Measure and then Count. Finish off by dragging License Status to the ‘Color’ box.
Finalized City Quadrant Table
  1. Dwelling Type Pie Chart – For the pie chart, first right click on the ROW section and click ‘New Calculation’. In the box, type in avg(0) to create a new ‘Mark’. There should now be an AGG(avg(0)) section under “Marks’, make sure the dropdown is selected at ‘Pie’. Then drag the Type of Residence column into the ‘Angle’ and ‘Color’ boxes. To further compute the percentage for each dwelling type, right click on the angle tab with the Type of Residence column in it then go the ‘Quick Table calculation’ and finally ‘Percent of Total’ .
Finalized pie chart
  1. Dashboard Creation – Once the above steps are complete, a dashboard can be made with the pieces by combining all 4 sheets in the Dashboard tab.
Finalized dashboard with the 4 created components

Limitations

The main limitations in this project comes from the data. Older licensing data is removed from the data set when the data set is updated daily by city staff. This presents the problem of not being able to compare full year to date data. As seen in the data set used in the dashboard, majority of the January data has already been removed from the data set with the except of January 26, 2020. Additionally, there were also quite a few entries in the data set that had null addresses which made it impossible to pinpoint where those addresses were. Lastly, as this data set is for 2020, the COVID-19 pandemic might have disrupted the amount of short term rentals being licensed due to both the city shifting priorities as well as more people staying home resulting in less vacant homes available for short term rentals.

Visualizing Spatial Distribution of SARS in Carto

by Cheuk Ying Lee (Damita)
Geovis Project Assignment @RyersonGeo, SA8905, Fall 2019

Project Link: https://c14lee.carto.com/builder/5ebe8c01-fb32-40bf-9cae-3b5f7326d02b/embed

Background
In 2003, there was a SARS (Severe Acute Respiratory Syndrome) outbreak in Southern China. The first cases were reported in Guangdong, China and quickly spread to other countries via air travel. I experienced all the preventive measures taken and school suspension, yet too young to realize the scale of the outbreak worldwide.

Technology
CARTO is used to visualize the spatial distribution of SARS cases by countries and by time. CARTO is a software as a service cloud computing platform that enables analysis and visualization of spatial data. CARTO requires a monthly subscription fee, however, a free account is available for students. With CARTO, a dashboard (incorporating interactive maps, widgets, selective layers) can be created.

Data
The data were obtained from World Health Organization under SARS (available here). Two datasets were used. The first dataset was compiled, containing information in the number of cumulative cases and cumulative deaths of each affected country, listed by dates, from March 17 to July 11, 2003. The second dataset was a summary table of SARS cases by countries, containing total SARS cases by sex, age range, number deaths, number of recovery, percentage of affected healthcare worker etc. The data were organized and entered into a spreadsheet in Microsoft Excel. Data cleaning and data processing were performed using text functions in excel. This is primarily done to removing the superscripts after the country names such that the software can recognize, as well as changing the data types from string to numbers.

Figure 1. Screenshot of the issues in the country names that have to be processed before uploading it to CARTO.

After trials of connecting the database to CARTO, it was found that CARTO only recognized “Hong Kong”, “Macau” and “Taiwan” as country names, therefore unnecessary characters have to be removed. After cleaning the data, the two datasets were then uploaded and connected to CARTO. If the country names can be recognized, the datasets will then automatically contain spatial information. The two datasets now in CARTO appear as follows:

Figure 2. Screenshot of the dataset containing the cumulative number of cases and deaths for each country by date.

Figure 3. Screenshot of the dataset containing the summary of SARS cases for each affected country.

Figure 4. Screenshot of the page to connect datasets to CARTO. A variety of file formats are accepted.

METHOD
After datasets have been connected to CARTO, layers and widgets can be added. First, layers were added simply by clicking “ADD NEW LAYER” and choosing the datasets. After the layer was successfully added, data were ready to be mapped out. To create a choropleth map of the number of SARS cases, choose the layer and under STYLE, specify the polygon colour to “by value” and select the fields and colour scheme to be displayed.

Figure 5. Screenshot showing the settings of creating a choropleth map.

Countries are recognized as polygons in CARTO. In order to create a graduated symbol map showing number of SARS cases, centroids of each country has to be computed first. This was done by adding a new analysis of “Create Centroids of Geometries”. After that, under STYLE, specify the point size and point colour to “by value” and select the field and colour scheme.

Figure 6. Sets of screenshots showing steps to create centroids of polygons. Click on the layer and under ANALYSIS, add new analysis which brings you to a list of available analysis.


Animation was also created to show SARS-affected countries affected by dates. Under STYLE, “animated” was selected for aggregation. The figure below shows the properties that can be adjusted. Play around with the duration, steps, trails, and resolution, these will affect the appearance and smoothness of the animation.


Figure 7. Screenshot showing the settings for animation.

Figure 8. Screenshot showing all the layers used.

Widgets were added to enrich the content and information, along with the map itself. Widgets are interactive tools for users where displayed information can be controlled and explored by selecting targeted filters of interest. Widgets were added simply by clicking “ADD NEW WIDGETS” and selecting the fields to be presented in the widget. Most of them were chosen to be displayed in category type. For each category type widget, data has to be configured by selecting the field that the widget will be aggregated by, for most of them, they are aggregated by country, showing the information of widget by countries. Lastly, the animation was accompanied by a time series type widget.

Figure 9. Sets of screenshots showing the steps and settings to create new widgets.

Figure 10. A screenshot of some of the widgets I incorporated.

FINAL PROJECT

The dashboard includes an interactive map and several widgets where users can play around with the different layers, pop-up information, widgets and time-series animation. Widgets information changed along with a change in the map view. Widgets can be expanded and collapsed depending on the user’s preference.

LIMITATION
For the dataset of SARS accumulated cases by dates, some dates were not available, which can affect the smoothness of the animation. In fact, the earliest reported SARS cases happened before March 17 (earliest date of statistics available on WHO). Although the statistics still included information before March 17, the timeline of how SARS was spread before March 17 was not available. In addition, there were some inconsistencies in the data. The data provided at earlier dates contain less information, including only accumulated cases and deaths of each affected country. However, data provided at later dates contain new information, such as new cases since last reported date and number of recovery, which was not used in the project in order to maintain consistency but otherwise could be useful in illustrating the topic and in telling a more comprehensive story.

CARTO only allows a maximum of 8 layers, which is adequate for this project, but this may possibly limit the comprehensiveness if used for other larger projects. The title is not available at the first glance of the dashboard and it is not able to show the whole title if it is too long. This could cause confusion since the topic is not specified clearly. Furthermore, the selective layers and legend cannot be minimized. This obscures part of the map, affecting users perception because it is not using all of its available space effectively. Lastly, the animation is only available for points but not polygons, which would otherwise be able to show the change in SARS cases (by colour) for each country by date (time-series animation of choropleth map) and increase functionality and effectiveness of the animation.

Visualizing Toronto Fire Service Response

By: Remmy Zelaya

Geovis Project Assignment @RyersonGeo, SA8905, Fall 2019

CARTO is an online tool to create online maps, dashboards, and perform spatial analysis. Basic membership is free and no coding experience is required to get your maps online. I creating my project on visualizing Toronto Fire Service data entirely in CARTO. The embedded map is below or you can click here to see it in a new tab.

I’ll briefly explain how I created my map and how you can too. 

Before we get to CARTO, we’ll need our data. The City of Toronto’s Open Data portal contains lots of free data on city services and life. From the portal I downloaded shapefiles of TFS stations and run areas (catchment areas for fire stations), and a CSV file of fire incidents.

Next create a CARTO account if you don’t already have one. Once logged in, the CARTO home page will have links to “Getting Started”, “New Map”, and “New dataset.” The Getting Started page is an excellent tutorial on CARTO for first time users. 

Before we start making a map, we will need to upload our data. Click “new dataset” and follow the prompts. Note, CARTO requires shapefiles to be archived in a ZIP file. 

Once that is done, click on “new map” and add your uploaded datasets. CARTO will add your datasets as layers to the map, zoom to layer extent, and automatically create a point layer out of the CSV file. 

The map is on the right side of the screen and a control panel with a list of the uploaded layers is on the right. From here we can do a couple of things;

  • Re-title our map by double clicking on the default title
  • Rearrange our layers by dragging and dropping. Layer order determines drawing order. Rearrange the layers so that the stations and incidents points are on top of the run area polygon.
  • Change the base map. I’ve used Positon Lite for a simple and clean look. Note, CARTO has options to import base maps and styles from other site, or to create your own.
  • Click on the layer card to bring up that layer’s options menu.

Let’s click on the fire stations layer. As with the map we can rename the layer by double clicking on the name. The layer menu has five panes, Data, Analysis, Style, Pop-Up, Legend. The Style pane will be selected by default. The first section of the Style pane is aggregation, which is useful for visualizing dense point layers. We’ll keep the default aggregation of By Point. Section 2 Style controls the appearance of the layer. I’ve changed my point colour to black and increased the size to 12. I need the stations to stand out from the incident points. 

Now with the incidents layer, I decided to use the Animation aggregation option. If the point layer has a column representing time, we can use this to create an animation of the points appearing on the map over time. This option creates a time slider widget at the bottom of the map with a histogram representing the amount of fires over time.

With the run areas, I decided to create a choropleth map where run areas with higher amount of incidents would appear darker on the map. To do this, I first need to determine how many incidents points fall into each run area. Go to the run area menu, click on Analysis, then “+Add New Analysis.” CARTO will navigate to a new page with a grid of its spatial analysis options. Click on “Intersect and Aggregate” which finds “overlapping geometries from a second layer and aggregate its values in the current layer.”

CARTO will navigate back to the Analysis pane of the run area menu and display options for the analysis. Run area should already be selected under Base Layer. Choose incidents as the target layer, and under Measure By select count. CARTO will display a message stating new columns have been added to the data, count_vals and count_vals_density. 

There will be an option to style the analysis. Click on it. Choose “by value” for Polygon Colour, and choose the new count_vals_density for Column, then select an appropriate colour scheme.

CARTO’s widget feature creates small boxes on the right of the map with useful charts and stats on our data. You click on the Widgets pane to start add new widgets from a grid (as with Analysis) or can add new widgets based on a specific layer from that layer’s Data pane. CARTO has four types of widgets;

  • Category creates a horizontal bar chart measuring how many features fit into a category. This widget also allows users to filter data on the map by category. 
  • Histogram creates a histogram measuring a selected variable
  • Formula displays a statistic on the data based on a selected formula
  • Time Series animates a layers according to its time information.

As with layers, clicking on a widget brings up its option menu. From here you can change the source data layer, the widget type, and configure data values. For my Fires by Run Area widget, I used the incidents layer as the source, aggregated by id_station (fire station ID numbers) using the count operation. This widget counts how many incidents each station responded to and displays a bar chart of the top 5 stations. Clicking on a station in the bar chart will filter the incidents by the associated station. After this, I added four formula based widgets.

We’re nearly done. Click on the “publish” button on the bottom left to publish the map to the web. CARTO will provide a link for other users to see the map and an HTML embed code to add it to a web page. I used the embed code to added the embedded map to the beginning of the post.

Thanks for reading. I hope you’ll use CARTO to create some nice maps of your own. You may be interested in checking out the CARTO blog to see other projects built on the platform or the Help section for my information on building your own maps and applications.

Visualizing Station Delays on the TTC

By: Alexander Shatrov

Geovis Project Assignment @RyersonGeo, SA8905, Fall 2018.

Intro:

The topic of this geovisualization project is the TTC. More specifically, the Toronto subway system and its many, many, MANY delays. As someone who frequently has to suffer through them, I decided to turn this misfortune into something productive and informative, as well as something that would give a person not from Toronto an accurate image of what using the TTC on a daily basis is like. A time-series map showing every single delay the TTC went through over a specified time period.  The software chosen for this task was Carto, due to its reputation as being good at creating time-series maps.

Obtaining the data:

First, an excel file of TTC subway delays was obtained from Toronto Open Data, where it is organised by month, with this project specifically using August 2018 data. Unfortunately, this data did not include XY coordinates or specific addresses, which made geocoding it difficult. Next, a shapefile of subway lines and stations was obtained from a website called the “Unofficial TTC Geospatial Data”. Unfortunately, this data was incomplete as it had last been updated in 2012 and therefore did not include the recent 2017 expansion to the Yonge-University-Spadina line. A partial shapefile of it was obtained from DMTI, but it was not complete. To get around this, the csv file of the stations shapefile was opened up, the new stations added, the latitude-longitude coordinates for all of the stations manually entered in, and the csv file then geocoded in ArcGIS using its “Display XY Data” function to make sure the points were correctly geocoded. Once the XY data was confirmed to be working, the delay excel file was saved as a csv file, and had the station data joined with it. Now, it had a list of both the delays and XY coordinates to go with those delays. Unfortunately, not all of the delays were usable, as about a quarter of them had not been logged with a specific station name but rather the overall line on which the delay happened. These delays were discarded as there was no way to know where exactly on the line they happened. Once this was done, a time-stamp column was created using the day and timeinday columns in the csv file.

Finally, the CSV file was uploaded to Carto, where its locations were geocoded using Carto’s geocode tool, seen below.

It should be noted that the csv file was uploaded instead of the already geocoded shapefile because exporting the shapefile would cause an issue with the timestamp, specifically it would delete the hours and minutes from the time stamp, leaving only the month and day. No solution to this was found so the csv file was used instead. The subway lines were then added as well, although the part of the recent extension that was still missing had to be manually drawn. Technically speaking the delays were already arranged in chronological order, but creating a time series map just based on the order made it difficult to determine what day of the month or time of day the delay occurred at. This is where the timestamp column came in. While Carto at first did not recognize the created timestamp, due to it being saved as a string, another column was created and the string timestamp data used to create the actual timestamp.

Creating the map:

Now, the data was fully ready to be turned into a time-series map. Carto has greatly simplified the process of map creation since their early days. Simply clicking on the layer that needs to be mapped provides a collection of tabs such as data and analysis. In order to create the map, the style tab was clicked on, and the animation aggregation method was selected.

The color of the points was chosen based on value, with the value being set to the code column, which indicates what the reason for each delay was. The actual column used was the timestamp column, and options like duration (how long the animation runs for, in this case the maximum time limit of 60 seconds) and trails (how long each event remains on the map, in this case set to just 2 to keep the animation fast-paced). In order to properly separate the animation into specific days, the time-series widget was added in the widget tab, located next to to the layer tab.

In the widget, the timestamp column was selected as the data source, the correct time zone was set, and the day bucket was chosen. Everything else was left as default.

The buckets option is there to select what time unit will be used for your time series. In theory, it is supposed to range from minutes to decades, but at the time of this project being completed, for some reason the smallest time unit available is day. This was part of the reason why the timestamp column is useful, as without it the limitations of the bucket in the time-series widget would have resulted in the map being nothing more then a giant pulse of every delay that happened that day once a day. With the time-stamp column, the animation feature in the style tab was able to create a chronological animation of all of the delays which, when paired with the widget was able to say what day a delay occurred, although the lack of an hour bucket meant that figuring out which part of the day a delay occurred requires a degree of guesswork based on where the indicator is, as seen below

Finally, a legend needed to be created so that a viewer can see what each color is supposed to mean. Since the different colors of the points are based on the incident code, this was put into a custom legend, which was created in the legend tab found in the same toolbar as style. Unfortunately this proved impossible as the TTC has close to 200 different codes for various situations, so the legend only included the top 10 most common types and an “other” category encompassing all others.

And that is all it took to create an interesting and informative time-series map. As you can see, there was no coding involved. A few years ago, doing this map would have likely required a degree of coding, but Carto has been making an effort to make its software easy to learn and easy to use. The result of the actions described here can be seen below.

https://alexandershatrov.carto.com/builder/8574ffc2-9751-49ad-bd98-e2ab5c8396bb/embed

Visual Story of GHG Emissions in Canada

By Sharon Seilman, Ryerson University
Geovis Project Assignment @RyersonGeo, SA8905, Fall 2018

Background

Topic: 

An evaluation of annual Greenhouse Gas (GHG) Emissions changes in Canada and an in-depth analysis of which provinces/ territories contribute to most of the GHG emissions within National and Regional geographies, as well as by economic sectors.

  • The timeline for this analysis was from 1990-2015
  • Main data sources: Government of Canada Greenhouse Gas Emissions Inventory and Statistics Canada
Why? 

Greenhouse gas emissions are compounds in the atmosphere that absorbs infrared radiation, thus trapping and holding heat in the atmosphere. By increasing the heat in the atmosphere, greenhouse gases are responsible for the greenhouse effect, which ultimately leads to global climate change. GHG emissions are monitored in three elements -its abundance in the atmosphere, how long it stays in the atmosphere and its global warming potential.

Audience: 

Government organizations, Environmental NGOs, Members of the public

Technology

An informative website with the use of Webflow was created, to visually show the story of the annual emissions changes in Canada, understand the spread of it and the expected trajectory. Webflow is a software as a service (SaaS) application that allows designers/users to build receptive websites without significant coding requirements. While the designer is creating the page in the front end, Webflow automatically generates HTML, CSS and JavaScript on the back end. Figure 1 below shows the user interaction interface of Webflow in the editing process. All of the content that is to be used in the website would be created externally, prior to integrating it into the website.

Figure 1: Webflow Editing Interface

The website: 

The website it self was designed in a user friendly manner that enables users to follow the story quite easily. As seen in figure 2, the information it self starts at a high level and gradually narrows down (national level, national trajectory, regional level and economic sector breakdown), thus guiding the audience towards the final findings and discussions. The maps and graphs used in the website were created from raw data with the use of various software that would be further elaborated in the next section.

Figure 2: Website created with the use of Webflow

Check out Canada’s GHG emissions story HERE!

Method

Below are the steps that were undertaken for the creation of this website. Figure 3 shows a break down of these steps, which is further elaborated below.

Figure 3:  Project Process

  1. Understanding the Topic:
    • Prior to beginning the process of creating a website, it is essential to evaluate and understand the topic overall to undertake the best approach to visualizing the data and content.
    • Evaluate the audience that the website would be geared towards and visualize the most suitable process to represent the chosen topic.
    • For this particular topic of understanding GHG emissions in Canada, Webflow was chosen because it allows the audience to interact with the website in a manner that is similar to a story; providing them with the content in a visually appealing and user friendly manner.
  2. Data Collection:
    • For the undertaking of this analysis, the main data source used was the Greenhouse Gas Inventory from the Government of Canada (Environment and Climate Change). The inventory provided raw values that could be mapped and analyzed in various geographies and sectors. Figure 4 shows an example of what the data looks like at a national scale, prior to being extracted. Similarly, data is also provided at a regional scale and by economic sector.

      Figure 4: Raw GHG Values Table from the Inventory
    • The second source for this visualization was the geographic boundaries. The geographic boundaries shapefiles for Canada at both a national scale and regional scale was obtained from Statistics Canada. Additionally, the rivers (lines) shapefile from Statistics Canada too was used to include water bodies in the maps that were created.
      • When downloading the files from Statistics Canada, the ArcGIS (.shp) format was chosen.
  3. Analysis:
    • Prior to undertaking any of the analysis, the data from the inventory report needed to be extracted to excel. For the purpose of this analysis, national, regional and economic sector data were extracted from the report to excel sheets
      • National -from 1990 to 2015, annually,
      • Regional -by province/territory from 1990 to 2015, annually
      • Economic Sector -by sector from 1990 to 2015, annually
    • Graphs:
      • Trend -after extracting the national level data from the inventory, a line graph was created in excel with an added trendline. This graph shows the total emissions in Canada from 1990 to 2015 and the expected trajectory of emissions for the upcoming five years. In this particular graph, it is evident that the emissions show an increasing trajectory. Check out the trend graph here!
      • Economic Sector -similar to the trend graph, the economic sector annual data was extracted from the inventory to excel. With the use of the available data, a stacked bar graph was created from 1990 to 2015. This graph shows the breakdown of emissions by sector in Canada as well as the variation/fluctuations of emissions in the sectors. It helps understand which sectors contribute the most and which years these sectors may have seen a significant increase or decrease. With the use of this graph, further analysis could be undertaken to understand what changes may have occurred in certain years to create such a variation. Check out the economic sector graph here!
    •  Maps:
      • National map -the national map animation was created with the use of ArcMap and an online GIF maker. After the data was extracted to excel, it was saved as a .csv files and uploaded to ArcMap. With the use of ArcMap, sixteen individual maps were made to visualize the varied emissions from 1990 to 2015. The provincial and territorial shapefile was dissolved using the ArcMap dissolve feature (from the Arc Tool box) to obtain a boundary file at a national scale (that was aligned with the regional boundary for the next map). Then, the uploaded table was joined to the boundary file (with the use of the Table join feature). Both the dissolved national boundary shapefile and the river shapefile were used for this process, with the data that was initially exported from the inventory for national emissions. Each map was then exported a .jpeg image and uploaded to the GIF maker, to create the animation that is shown in the website. With the use of this visualization, the viewer can see the variation of emissions throughout the years in Canada. Check out the national animation map here!
      •  Regional map -similar to the national one, the regional map animation was created in same process. However, for the regional emissions, data was only available for three years (1990, 2005 and 2015). The extracted data .csv file was uploaded and table joined to the provinces and territories shapefile (undissolved), to create three choropleth maps. The three maps were them exported as .jpeg images and uploaded to the GIF maker to create the regional animation. By understanding this animation, the viewer can distinctly see which regions in Canada have increase, decreased or remained the same with its emissions. Check out the regional animation map here!
  4. Final output/maps:
    • The graphs and maps that were discussed above were exported as images and GIFs to integrate in the website. By evaluating the varied visualizations, various conclusions and outputs were drawn in order to understand the current status of Canada as a nation, with regards to its GHG emissions. Additional research was done in order to assess the targets and policies that are currently in place about GHG emissions reductions.
  5. Design and Context:
    • Once the final output and maps were created, and the content was drafted, Webflow enables the user to easily upload external content via the upload media tool. The content was then organized with the graphs and maps that show a sequential evaluation of the content.
    • For the purpose of this website, an introductory statement introduces the content discussed and Canada’s place in the realm of Global emissions. Then the emissions are first evaluated at a national scale with the visual animation, then the national trend, regional animation and finally, the economic sector breakdown. Each of the sections have its associated content and description that provides an explanation of what is shown by the visual.
    • The Learn More and Data Source buttons in the website include direct links to Government of Canada website about Canada’s emissions and the GHG inventory itself.
    • The concluding statement provides the viewer with an overall understanding of Canada’s status in GHG emissions from 1990 to 2015.
    • All of the font formatting and organizing of the content was done within the Webflow interface with the end user in mind.
  6. Webflow:
    • The particular format that was chosen in for this website because of story telling element of it. Giving the viewer the option to scrolls through the page and read the contents of it, works similarly as story because this website was created for informative purposes.

Lessons Learned: 

  • While the this website provides informative information, it could be further advanced through the integration of an interactive map, with the use of additional coding. This however would require creating the website outside of the Webflow interface.
  • Also, the analysis could be further advanced with the additional of municipal emissions values and policies (which was not available in the inventory it self)

Overall, the use of Webflow for the creation of this website, provides users with the flexibility to integrate various components and visualizations. The user friendly interface enables uses with minimal coding knowledge to create a website that could be used for various purposes.

Thank you for reading. Hope you enjoyed this post!

Visualizing Urban Land Use Growth in Greater Sào Paulo

By: Kevin Miudo

Geovis Project Assignment @RyersonGeo, SA8905, Fall 2018

https://www.youtube.com/watch?v=Il6nINBqNYw&feature=youtu.be

Introduction

In this online development blog for my created map animation, I intend to discuss the steps involved in producing my final geovisualization product, which can be viewed above in the embedded youtube link. It is my hope that you, the reader, learn something new about GIS technologies and can apply any of the knowledge contained within this blog towards your own projects. Prior to discussing the technical aspects of the map animations development, I would like to provide some context behind the creation of my map animation.

Cities within developing nations are experiencing urban growth at a rapid rate. Both population and sprawl are increasing at unpredictable rates, with consequences for environmental health and sustainability. In order to explore this topic, I have chosen to create a time series map animation visualizing the growth of urban land use in a developing city within the Global South. The City which I have chosen is Sào Paulo, Brazil. Sào Paulo has been undergoing rapid urban growth over the last 20 years. This increase in population and urban sprawl has significant consequences to climate change, and such it is important to understand the spatial trend of growth in developing cities that do not yet have the same level of control and policies in regards to environmental sustainability and urban planning. A map animation visualizing not only the extent of urban growth, but when and where sprawl occurs, can help the general public get an idea of how developing cities grow.

Data Collection

In-depth searches of online open data catalogues for vector based land use data cultivated little results. In the absence of detailed, well collected and precise land use data for Sào Paulo, I chose to analyze urban growth through the use of remote sensing. Imagery from Landsat satellites were collected, and further processed in PCI Geomatica and ArcGIS Pro for land use classification.

Data collection involved the use of open data repositories. In particular, free remotely sensed imagery from Landsat 4, 5, 7 and 8 can be publicly accessed through the United States Geological Survey Earth Explorer web page. This open data portal allows the public to collect imagery from a variety of satellite platforms, at varying data levels. As this project aims to view land use change over time, imagery was selected at data type level-1 for Landsat 4-5 Thematic Mapper and Landsat 8 OLI/TIRS. Imagery selected had to have at least less than 10% cloud cover, and had to be images taken during the daytime so that spectral values would remain consistent across each unsupervised image classification.

Landsat 4-5 imagery at 30m spectral resolution was used for the years between 2004 and 2010. Landsat-7 Imagery at 15m panchromatic resolution was excluded from search criteria, as in 2003 the scan-line corrector of Landsat-7 failed, making many of its images obsolete for precise land use analysis. Landsat 8 imagery was collected for the year 2014 and 2017. All images downloaded were done so at the Level-1 GeoTIFF Data Product level. In total, six images were collected for years 2004, 2006, 2007, 2008, 2010, 2014, 2017.

Data Processing

Imagery at the Level-1 GeoTIFF Data Product Level contains a .tif file for each image band produced by Landsat 4-5 and Landsat-8. In order to analyze land use, the image data must be processed as a single .tiff. PCI Geomatica remote sensing software was employed for this process. By using the File->Utility->Translate command within the software, the user can create a new image based on one of the image bands from the Landsat imagery.

For this project, I selected the first spectral band from Landsat 4-5 Thematic Mapper images, and then sequentially added bands 2,3,4,5, and band 7 to complete the final .tiff image for that year. Band 6 is skipped as it is the thermal band at 120m spatial resolution, and is not necessary for land use classification. This process was repeated for each landsat4-5 image.Similarly for the 2014 and 2017 Landsat-8 images, bands 2-7 were included in the same manner, and a combined image was produced for years 2014 and 2017.

Each combined raster image contained a lot of data, more than required to analyze the urban extent of Sào Paulo and as a result the full extent of each image was clipped. When doing your own map animation project, you may also wish to clip data to your study area as it is very common for raw imagery to contain sections of no data or clouds that you do not wish to analyze. Using the clipping/subsetting option found under tools in the main panel of PCI Geomatica Focus, you can clip any image to a subset of your choosing. For this project, I selected the coordinate type ‘lat/long’ extents and input data for my selected 3000×3000 pixel subset. The input coordinates for my project were: Upper left: 46d59’38.30″ W, Upper right: 23d02’44.98″ S, Lower right: 46d07’21.44″ W, Lower Left: 23d52’02.18″ S.

Land Use Classification

The 7 processed images were then imported into a new project in ArcPro. During importation, raster pyramids were created for each image in order to increase processing speeds.  Within ArcPro, the Spatial Analyst extension was activated. The spatial analyst extension allows the user to perform analytical techniques such as unsupervised land use classification using iso-clusters. The unsupervised iso-clusters tool was used on each image layer as a raster input.

The tool generates a new raster that assigns all pixels with the same or similar spectral reluctance value a class. The number of classes is selected by the user. 20 classes were selected as the unsupervised output classes for each raster. It is important to note that the more classes selected, the more precise your classification results will be. After this output was generated for each image, the 20 spectral classes were narrowed down further into three simple land use classes. These classes were: vegetated land, urban land cover, and water. As the project primarily seeks to visualize urban growth, and not all types of varying land use, only three classes were necessary. Furthermore, it is often difficult to discern between agricultural land use and regular vegetated land cover, or industrial land use from residential land use, and so forth. Such precision is out of scope for this exercise.

The 20 classes were manually assigned, using the true colour .tiff image created from the image processing step as a reference. In cases where the spectral resolution was too low to precisely determine what land use class a spectral class belong to, google maps was earth imagery referenced. This process was repeated for each of the 7 images.

After the 20 classes were assigned, the reclassify tool under raster processing in ArcPro was used to aggregate all of the similar classes together. This outputs a final, reclassified raster with a gridcode attribute that assigns respective pixel values to a land use class. This step was repeated for each of the 7 images. With the reclassify tool, you can assign each of the output spectral classes to new classes that you define. For this project, the three classes were urban land use, vegetated land, and water.

Cartographic Element Choices:

 It was at this point within ArcPro that I had decided to implement my cartographic design choices prior to creating my final map animation.

For each layer, urban land use given a different shade of red. The later the year, the darker and more opaque the colour of red. Saturation and light used in this manner helps assist the viewer to indicate where urban growth is occurring. The darker the shade of red, the more recent the growth of urban land use in the greater Sào Paulo region. In the final map animation, this will be visualized through the progression of colour as time moves on in the video.

ArcPro Map Animation:

Creating an animation in ArcPro is very simple. First, locate the animation tab through the ‘View’ panel in ArcPro, then select ‘Add animation’. Doing so will open a new window below your work space that will allow the user to insert keyframes. The animation tab contains plenty of options for creating your animation, such as the time frame between key frames, and effects such as transitions, text, and image overlays.

For the creation of my map animation, I started with zoomed-out view of South America in order to provide the viewer with some context for the study area, as the audience may not be very familiar with the geography of Sào Paulo. Then, using the pan tool, I zoomed into select areas of choice within my study area, ensuring to create new keyframes every so often such that the animation tool creates a fly-by effect. The end result explores the very same mapping extents as I viewed while navigating through my data.

While making your own map animation, ensure to play through your animation frequently in order to determine that the fly-by camera is navigating in the direction you want it to. The time between each keyframe can be adjusted in the animation panel, and effects such as text overlays can be added. Each time I activated another layer for display to show the growth of urban land use from year to year, I created a new keyframe and added a text overlay indicating to the user the date of the processed image.

Once you are satisfied with your results, you can export your final animation in a variety of formats, such as .avi, .mov, .gif and more. You can even select the type of resolution, or use a preset that automatically configures your video format for particular purposes. I chose the youtube export format for a final .mpeg4 file at 720p resolution.

I hope this blog was useful in creating your very own map animation on remotely sensed and classified raster data. Good luck!

Geovisualizing “Informality” – Using OpenStreetMap & Story Maps to tell the story of infrastructure in Kibera (Nairobi, Kenya)

by Melanie C. MacDonald
Geovis Project Assignment @RyersonGeo, SA8905, Fall 2017

From November 8th to 16th, 2017, I ran a small mapping campaign to generate building data in Kibera (Nairobi, Kenya) using OpenStreetMap (OSM). OSM is a collaborative online project whose aim is to create a free, editable ‘world map’ for anyone to use. The foundation(s) of OSM are rooted in both participation and partnership (i.e. the open-source movement) and restriction (i.e. the growing complexity of data and copyright constraints in many fields of work); collaboration was OSMs direct response to these notable growing restrictions and, as a results, I felt the best – and most interesting – technology suited for my geovisualization project. Overall, my personal campaign resulted in the contribution of 6770 buildings generated from known sources – mostly myself – and 1101 from ‘unknown’ sources (to me).

Importance:

Building data in informal settlements (or “slums”) is difficult to generate and/or find. While my research efforts, which included an informal interview/discussion with colleagues in Kenya, uncovered that building data for Kibera does in fact exist, it is prohibitively expensive and inaccessible to most people, including myself. (Note: Despite being a student and a former researcher in Nairobi, this was the case.) To further this, copyright law protects any data extracted in the private sector, making it more complicated to use this data to create a map for the public. Because I wanted to use this geovisualization project to create such a map – accessible to anyone (using the technology available through Esri’s Story Maps) and educational, the case for OSM became even stronger.

Steps taken: how and where to start?

The first step of my project was to learn how OpenStreetMap (OSM) works. Because OSM is intuitive, the steps I took were simple: (1) visit the website, www.openstreetmap.org; (2) create an account (“Sign Up”); (3) Log In; (4) type in “Kibera, Nairobi, Kenya” into the search field; (3) click “edit”; (4) follow the tutorial that OSM offers before you make your first edit; (5) select “Area” and zoom all the way into the rooftops of the buildings to create polygons that mark the geolocation of each structure (double-click to close the polygon); (6) select “Building” from the options in the left-bar (Note: if this process was done with people who live in these neighbourhoods, the names of what each building could be included in the data extraction, which would create more possibility for analysis in the future); (7) click the “check-mark” (perhaps the most important step to saving the data, and then “Save” on the top banner.

These steps were repeated until a chosen portion of Kibera was completed. The above instructions were emailed to a few willing participants and a “call” for participation via Twitter, too, was done periodically over the course of 6 days. My building extraction started from the beginning of an “access road” at the furthest South-Eastern point of Kibera in a village called Soweto-East, where I had conducted research about a contentious “slum-upgrading” programme 4 years ago.

Over the course of 6 days, I made 31,691 edits to OSM over all, which included all actions (deleting incorrect buildings, creating nodes, moving things, etc.). In total, I created 5471 buildings and 1299 were created by friends and family, resulting in 6770 buildings in total. However, when I extracted this building data, first loading it into QGIS and then exporting that shapefile into ArcGIS, 7871 buildings were counted (extracted/cleaned) in this area South of the railway (which runs along the northern part of the outside boundary). I cannot account for who created 1101 buildings (perhaps success attributed to social media efforts?), but 86% of the area was ‘mapped’ over a 6-day period.

It’s often said, for perspective purposes, that Kibera is “two-thirds the size of Central Park in New York”, but the precise calculation of area it covered is less-often (if ever) expressed. I wasn’t able to contribute to an absolutely calculation, either, but: not accounting for elevation or other things, at its longest and widest, the area of Kibera covered in this 6-day period was approximately 2000m x 1500m. It’s imprecise, but: imagine someone running around a 400m track 5 times and you have the length of the area in focus – thousands of buildings that are homes, businesses, schools, medical clinics, and so on the equivalent of maybe 10 football fields (12 or 13 acres).

 Accuracy, Precision & Impact

It was often difficult to determine where the lines began and ended. Because of the corrugated metal material that’s used to build homes, schools, businesses (and more), the light flares from the sun, captured from the satellite imagery, made for guesswork in some instances. The question then became: why bother? Is there a point, or purpose, to capturing these structures at all if it’s impossible to be precise?

Much of the work to date with open-source data in this particular community in this particular part of the world is deeply rooted in protecting people; keeping people safe. Reading about the origins of mapping efforts by an organization called Map Kibera can reveal a lot about the impact(s) and challenges of creating geodata in informal settlements (or “slums”). The process of drawing thousands of polygons to represent buildings that are most often considered to be precarious or impermanent housing was enlightening. One of the main take-away ‘lessons’ was that data production and availability is critical – without data, we don’t have much to work with as spatial analysts.

Practical Implications: the “Story Map”

While new data production was one of the goals of this geovisualization project, the second challenge goal was to find a way of communicating the results. As a technology, Esri’s Story Maps technology was the most useful because it allowed me to link the OSM map as a basemap, which helped maintain the open-source ‘look’ to the map. Without much effort, the 7871 new buildings, covering 7 of the 13 villages in Kibera, were automatically available using this basemap. Because I took stop-motion videos of the OSM building extraction process, I was able to create point data on my Story Map to link to these videos. With “education” as one of the goals of the project – both of the infrastructure in Kibera itself, and of how to use OSM, in general – people unfamiliar with OSM tools and how they can be used/useful in the context of missing data in informal settlements (or “slums”) could familiarize themselves with both. In addition, I included interesting, personal photos from prior-research/work in this area, further adding to the “story” of infrastructure in the community. The Story Map is available here.

Print: Formalizing the Informal

The initial goal of this geovisualization project was to demonstrate that there is beauty and art in the creation of data, particularly when it is collaborative and made to be openly-accessible, unrestricted, and for anyone to use. After I proposed to create and extract building data from Kibera, I wanted to use a special printing technology to have the building data etched into an aluminum composite material called dibond. The idea was to have this piece of collaborative work (about a place commonly labeled a “slum”) gallery-ready and ultimately “legitimized” simply by being etched into something permanent (this idea of “legitimate” is tongue-in-cheek, to be clear). The technology available to etch into dibond is limited in the city, however, and when time-limitations made the etching-goal prohibitive, I decided to have the final product printed and mounted onto dibond as a compromise. In the end, the result of having the mounting material hidden was conceptually true to the goal of the project – to draw attention to the reality that real people with rich lives maintain these homes, businesses, schools, community centres, etc., regardless of the assumptions what that corrugated metal material may indicate. Paired with the Esri Story Map, this print was useful at drawing the attention of people into the digital story, which was loaded onto a computer for the day of the formal project presentation. Now, however, the 24×36 print hands on my wall, generating conversation about the entire process of this project and the potential impacts of open-source data. Having spent 3 years of my life examining the impacts of public participation when designing infrastructure changes (which hopefully lead to improvements in quality of life), this print – and process – could not have a better ‘home’.

#AddressingTheSurface Translucent Maps inspired by GIS and Open Data

by Edgar Baculi #themapmaker
Geovisualization Project @RyersonGeo, SA8905, Fall 2017

#AddressingTheSurface was a collaborative geovisualization project with recent OCAD University graduate, Graphic Designer and Fine Artist Jay Ginsherman, with ideas and direction from Ryerson University, Master of Spatial Analysis candidate Edgar Baculi. This project was inspired by the previous work of Ginsherman entitled ‘Liquid Shadows’ using translucent images or maps as well as a lighting device nicknamed the ‘Lightbox’. This piece along with Ginsherman’s previous and on-going work can be found here http://jginsherman.format.com/. While attending OCAD University’s 102nd GradEx, Baculi encountered the work of Ginsherman and the GIS like experience of the attendees. From this the idea of using open data and actual GIS to produce a piece had begun.

After consulting with Ginsherman a piece based on the lived experience of Baculi, open data and GIS was established. Having previous research work in open data, Baculi was familiar with exploring and downloading open data. The Toronto Open Data Catalogue provided all the data relevant to the project. The key focus of the data collection were datasets related to Toronto Community Housing and services of interest for these residents and other locations.

The following datasets were downloaded and manipulated from the catalogue:
1. Toronto Community Housing Corporation Residences (with high, mid and low rise buildings selected and divided into three map layers)
2. The boundary of the city of Toronto (dissolved former municipality shape file)
3. City of Toronto Neighbourhoods
4. Street file
5. Fire Stations
6. Police Stations
7. Park Land
8. TTC Subway lines
9. Three heat/ kernel density maps on services of interest for TCHC residents (based on Rent Bank Centres, Community Cooling Centres and Shelters.

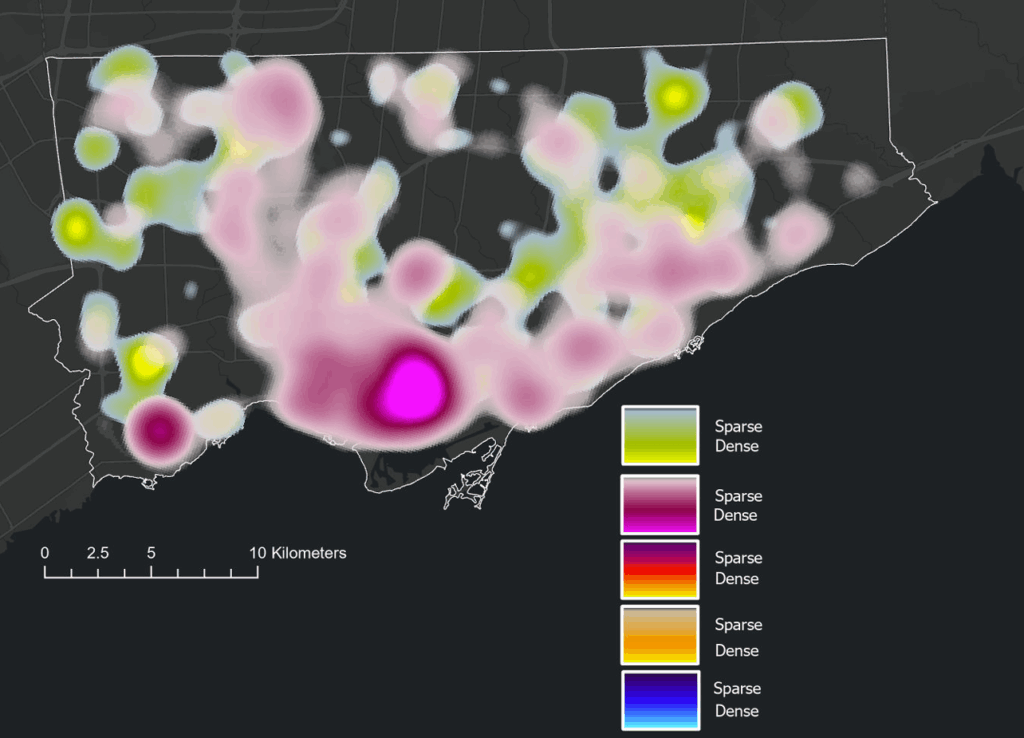
A key aspect of this project was the use of subtractive colours (Magenta, Yellow and Cyan) for the heat maps to show interesting overlap, resulting in new colours. The overlap of colours were designed intentionally to be open to interpretation to the map readers.

Using ArcGIS the previously mentioned datasets were adjusted by Baculi with ideal symbology before being sent to Ginsherman. The discussions between Baculi and Ginsherman involved understanding how GIS works and cartographic ideals for the look of the maps, with great design to appeal to the audience. Baculi wanted to create a hands on GIS experience, with a legend that built itself up and remained legible to the map reader. Ginsherman incorporated these ideals into the final look under Baculi’s direction.

Once Baculi completed the GIS portion of the layers, they were sent off to Ginsherman to improve design, layout and to print. Ginsherman used PDF’s of the layers in adobe illustrator, and ensured map alignment by limiting the work to the same illustrator file and giving each map its own layer. Printing involved using a laser printer, specifically at the OCAD University Digital Print Centre. Previous draft layers were also created to test the colour combinations and the best level of transparency for the maps.

A key component of the piece was the Lightbox from Ginsherman’s previous work which was designed and built by Ginsherman and his father. The Lightbox is made of wood, acrylic glass, and LED lights which were screwed together. The Toronto boundary layer was the only layer not printed on a translucent sheet, but on the glass. The boundary along with the north arrow acted as guides to align the layering of the maps. The LED lights improved the clarity of the layering maps as well as directed attention to the piece.

The end result was presented on Ryerson’s 2017 GIS Day and consisted of a Lightbox with the Toronto boundary printed on top and a total of 12 translucent maps. A variety of combinations were possible for interaction and discussion for the attendees. Please see the YouTube video below!