Visualizing Population on a 3D-Printed Terrain of Ontario

Xingyu Zeng

Geovisual Project Assignment @RyersonGeo, SA8905, Fall 2022

Introduction

3D visualization is an essential and popular category in geovisualization. After a period of development, 3D printing technology has become readily available in people’s daily lives. As a result, 3D printable geovisualization project was relatively easy to implement at the individual level. Also, compared to electronic 3D models, the advantages of explaining physical 3D printed models are obvious when targeting non-professional users.

Data and Softwares

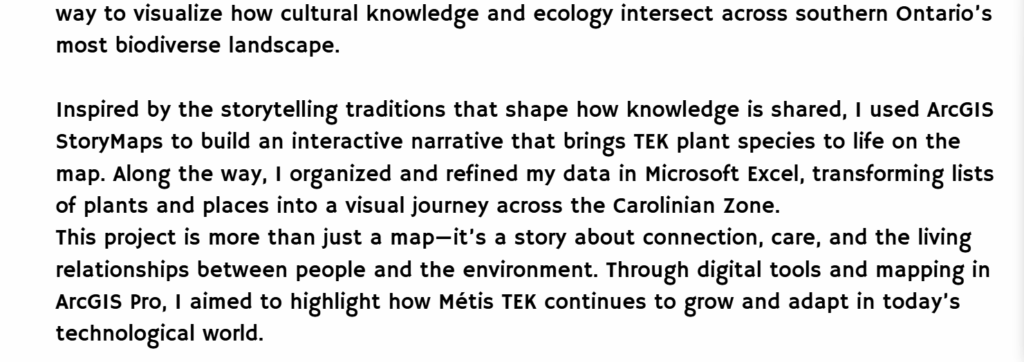
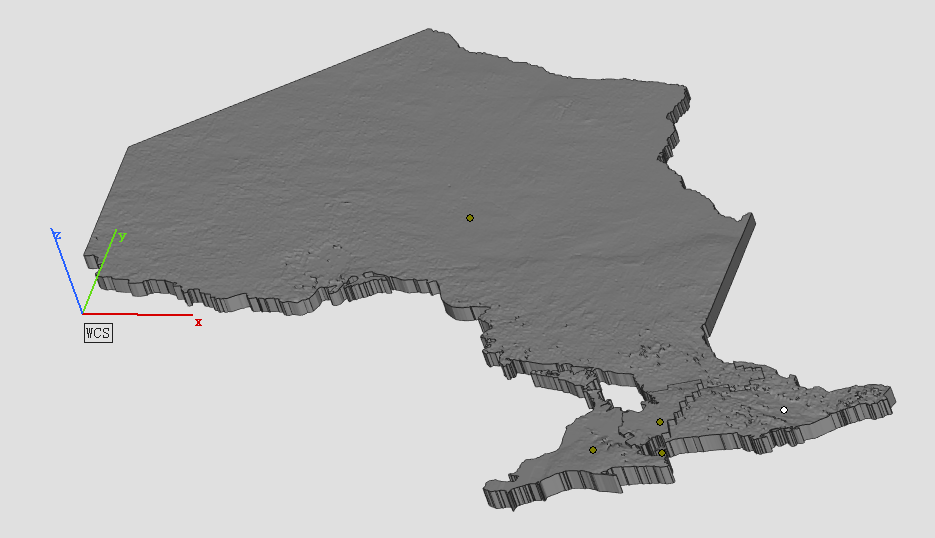
3D model in Materialise Magics
  • Data Source: Open Topography – Global Multi-Resolution Topography (GMRT) Data Synthesis
  • DEM Data to a 3D Surface: AccuTrans 3D – which provides translation of 3D geometry between the formats used by many 3D modeling programs.
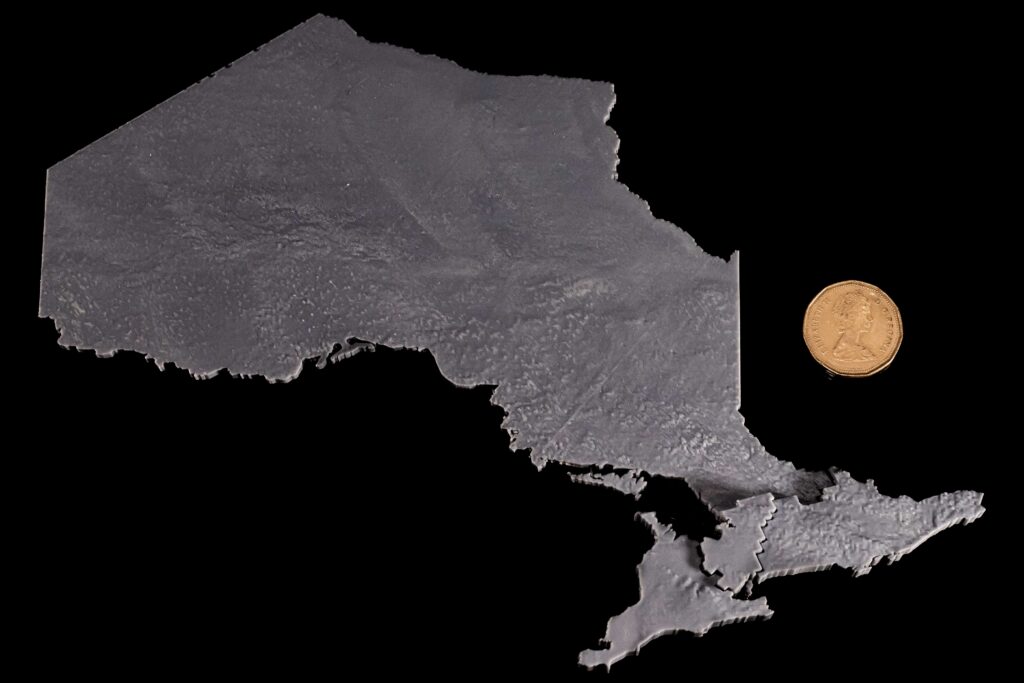
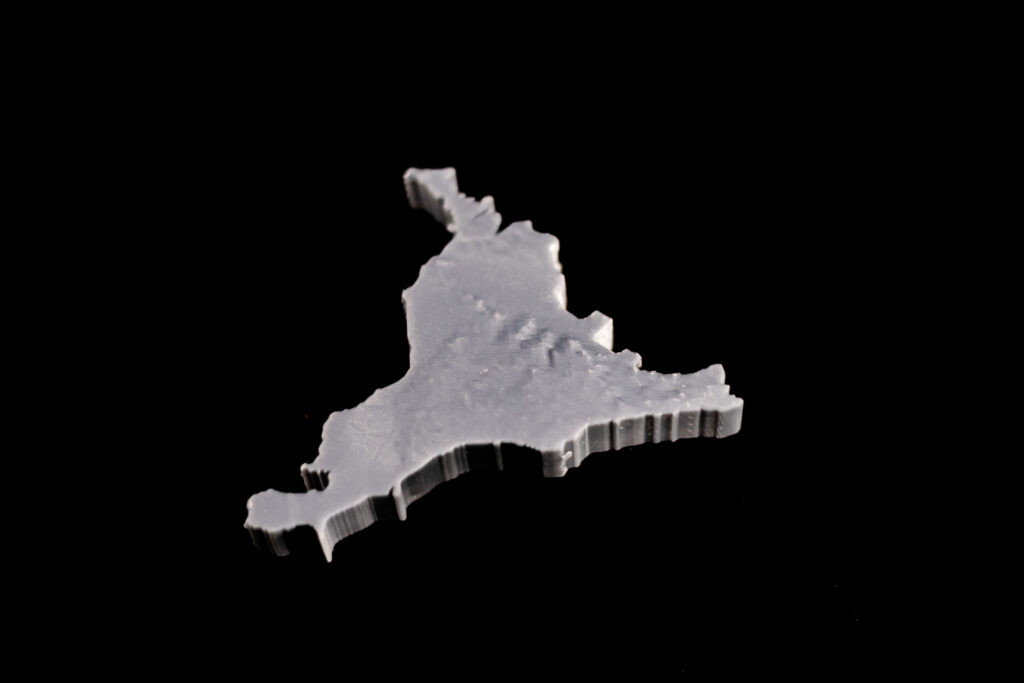
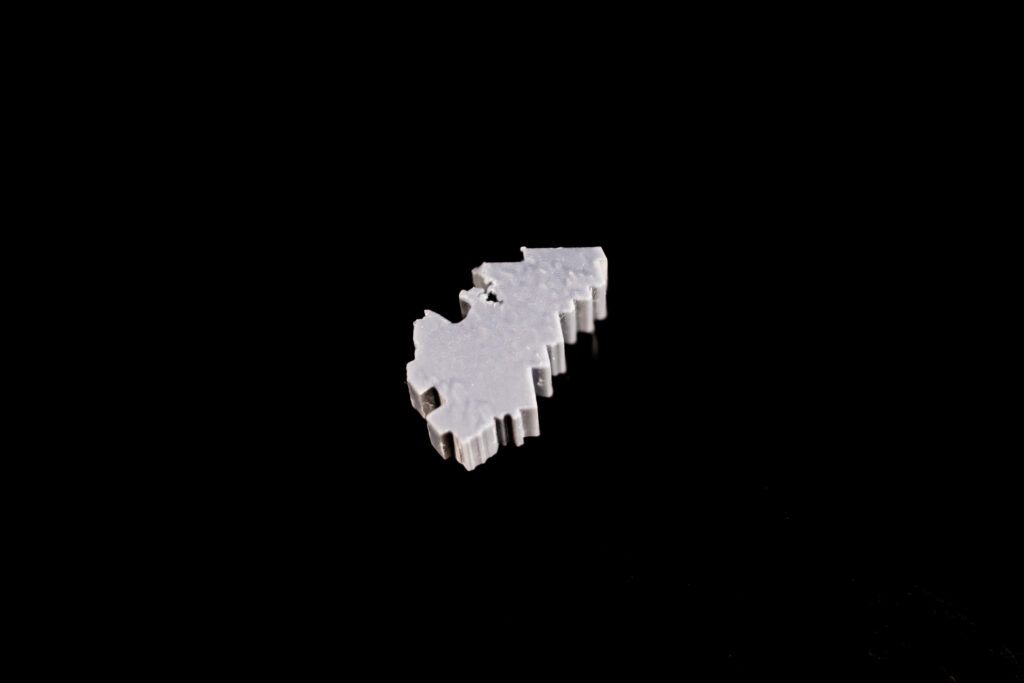
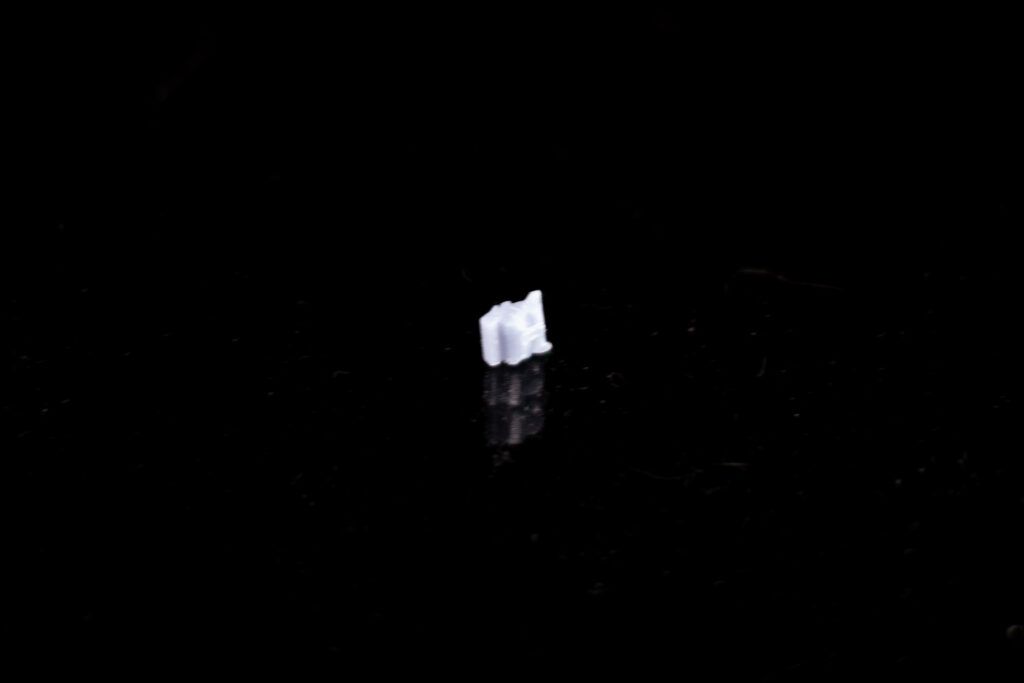
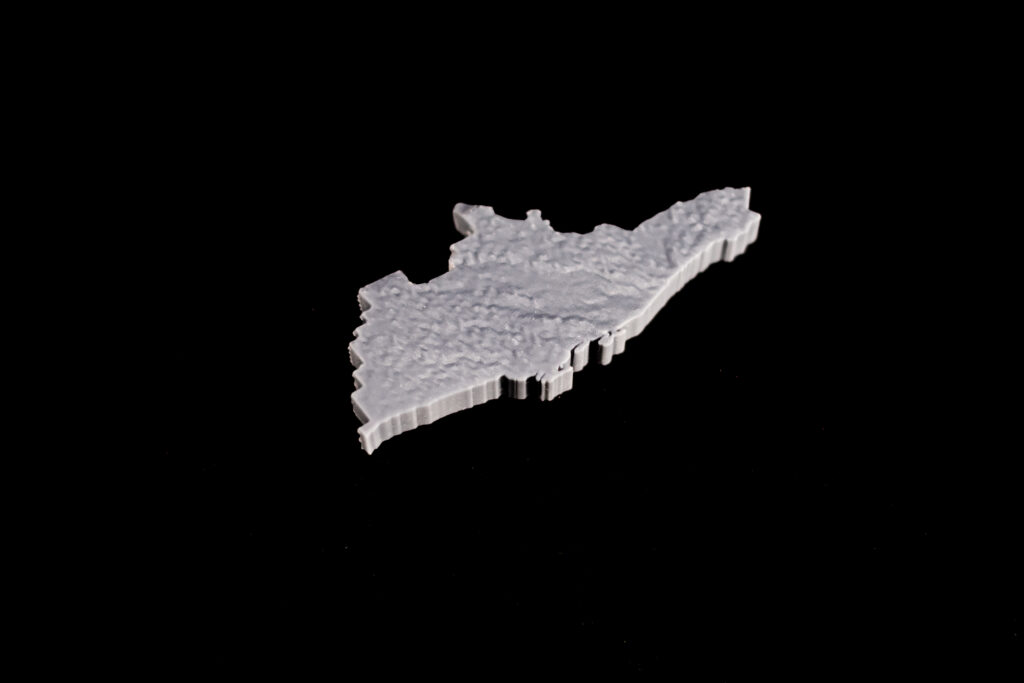
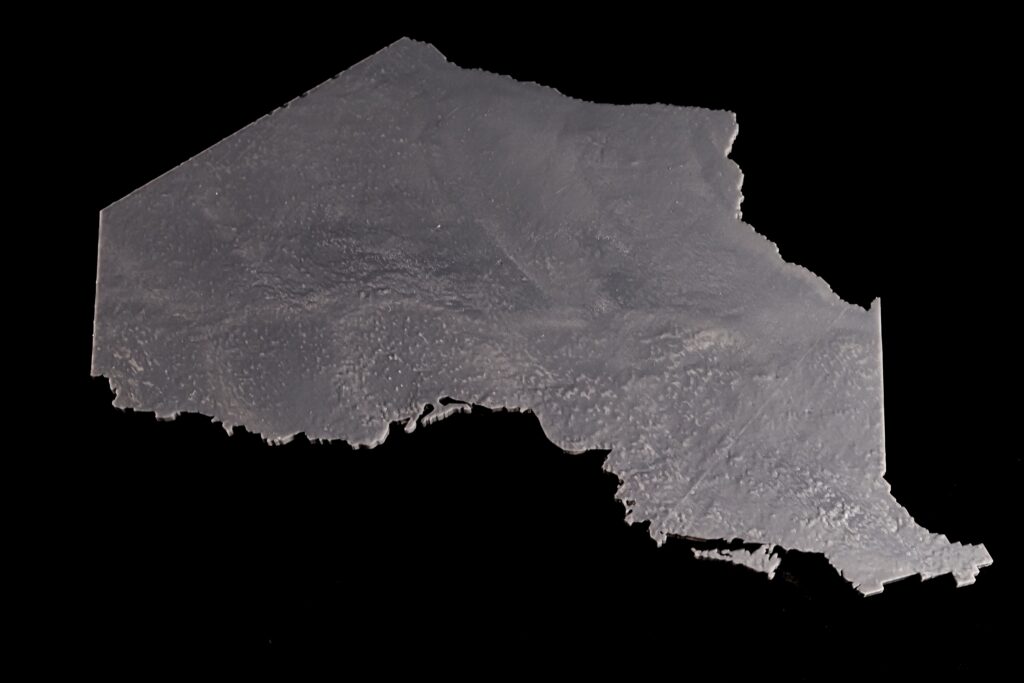
  • Converting a 3D Surface to a Solid: Materialise Magics – Converting surface to a solid with thickness and the model is cut according to the boundaries of the 5 Transitional Regions of Ontario. Using different thicknesses representing the differences in total population between Transitional Regions. (e.g. The central region has a population of 5 million, and the thickness is 10 mm; the west region has a population of 4 million the thickness is 8 mm)
  • Slicing & Printing: This step is an indispensable step for 3D printing, but because of the wide variety of printer brands on the market, most of them have their own slicing software developed by the manufacturers, so the specific operation process varies. But there is one thing in common, after this step, the file will be transferred to the 3D printer, and what follows is a long wait.

Visualization

The 5 Transitional Regions is reorganized by the 14 Local Health Integration Network (LHIN), and the corresponding population and model heights (thicknesses) for each of the five regions of Ontario are:

  • West, clustering of: Erie-St. Clair, South West, Hamilton Niagara Haldimand Brant, Waterloo Wellington, has a total population of about 4 million, the thickness is 8mm.
  • Central, clustering of: Mississauga Halton, Central West, Central, North Simcoe Muskoka, has a total population of about 5 million, the thickness is 10mm.
  • Toronto, clustering of: Toronto Central, has a total population of about 1.4 million, the thickness is 2.8mm.
  • East, clustering of: Central East, South East, Champlain, has a total population of about 3.7 million, the thickness is 7.4mm.
  • North, clustering of: North West, North East, has a total population of about 1.6 million, the thickness is 3.2mm.
Different thicknesses
Dimension Comparison
West region
Central region
Toronto
East region
North region

Limitations

The most unavoidable limitation of 3D printing is the accuracy of the printer itself. It is not only about the mechanical performance of the printer, but also about the materials used, the operating environment (temperature, UV intensity) and other external factors. The result of these factors is that the printed models do not match exactly, even though they are accurate on the computer. On the other hand, the 3D printed terrain can only represent variables that can be presented by unique values, such as the total population of my choice.

Visualizing Flow Regulation at the Shand Dam

Hannah Gordon

GeovisProject Assignment @RyersonGeo, SA8905, Fall 2022

Concept

When presented with this geovisualization opportunity I knew I wanted my final deliverable to be interactive and novel. The idea I decided on was a 3D printed topographic map with interactive elements that would allow the visualization of flow regulation from the Shand Dam by placing wooden dowels in holes of the 3D model above and below the dam to see how the dam regulated flow. This concept visualizes flow (cubic meters of water a second) in a way similar to a hydrograph, but brings in 3D elements and is novel and fun as opposed to a traditional chart.   Shand Dam on the Grand River was chosen as the site to visualize flow regulation as the Grand River is the largest river system in Southern Ontario, Shand Dam is a Dam of Significance, and  there are hydrometric stations that record river discharge above and below the dam for the same time periods (~1970-2022). 

About Shand Dam

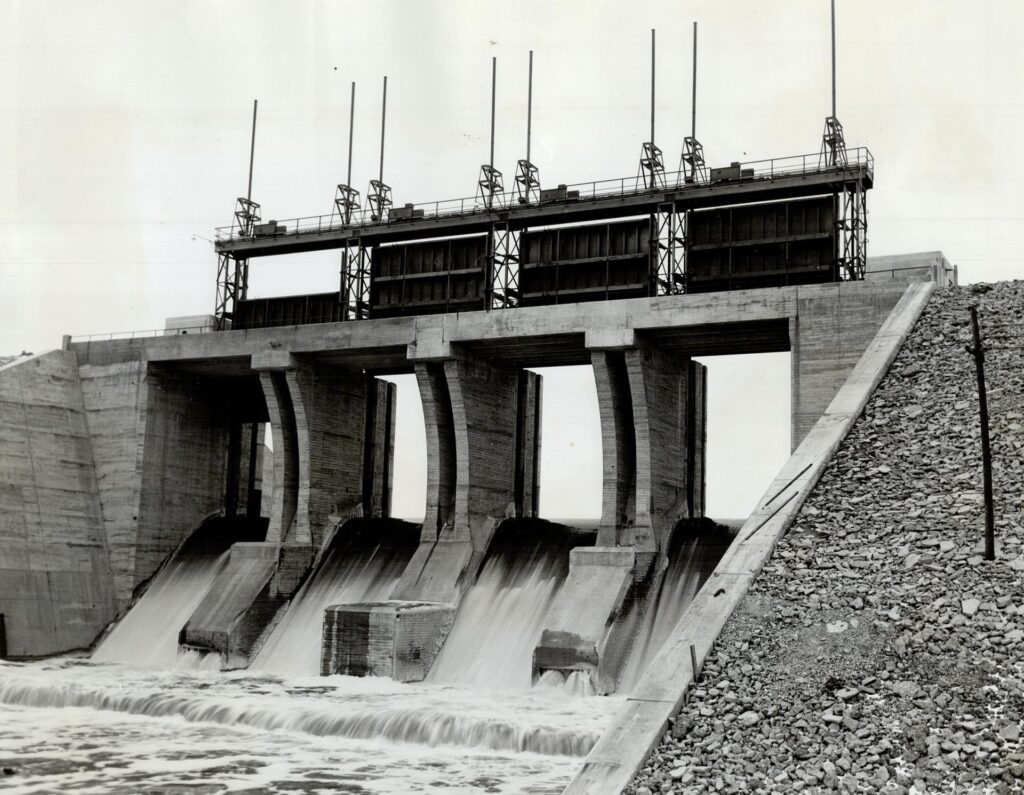
Dams and reservoirs like the Shand Dam are designed to provide maximum flood storage following peak flows. During high flows (often associated with spring snow melt) water is held in the reservoir to reduce the amount of flow downstream, lowering flood peak flows (Grand River Conservation Authority, 2014). Shand Dam (constructed in 1942 as Grand Valley Dam) is located just south of Belwood Lake (an artificial reservoir) in Southern Ontario, and provides significant flow regulation and low flow augmentation that prevents flooding south of the dam (Baine, 2009). Shand Dam proved a valuable investment in 1954 after Hurricane Hazel when no lives were lost in the Grand River Watershed from the hurricane.

Shand Dam (at the time Grand Valley Dam) in 1942. Photographer: Walker, A., 1942

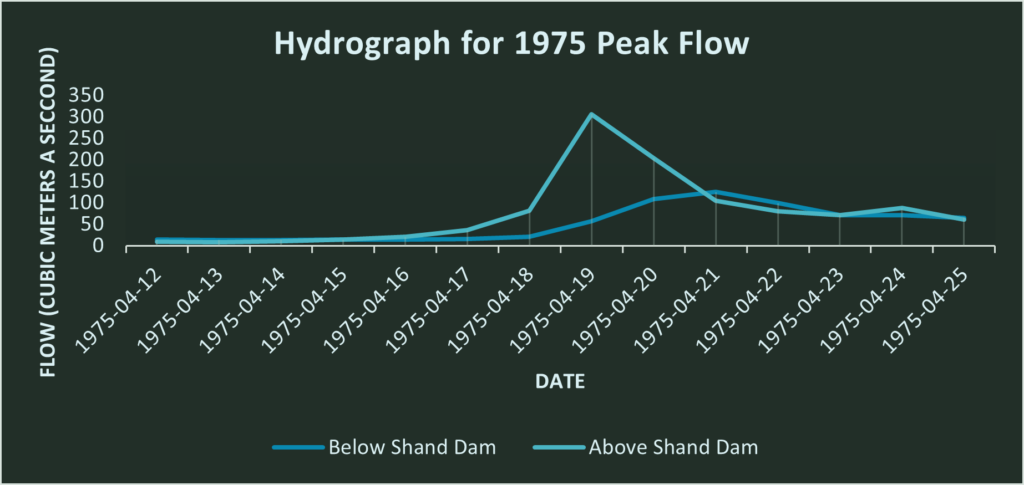
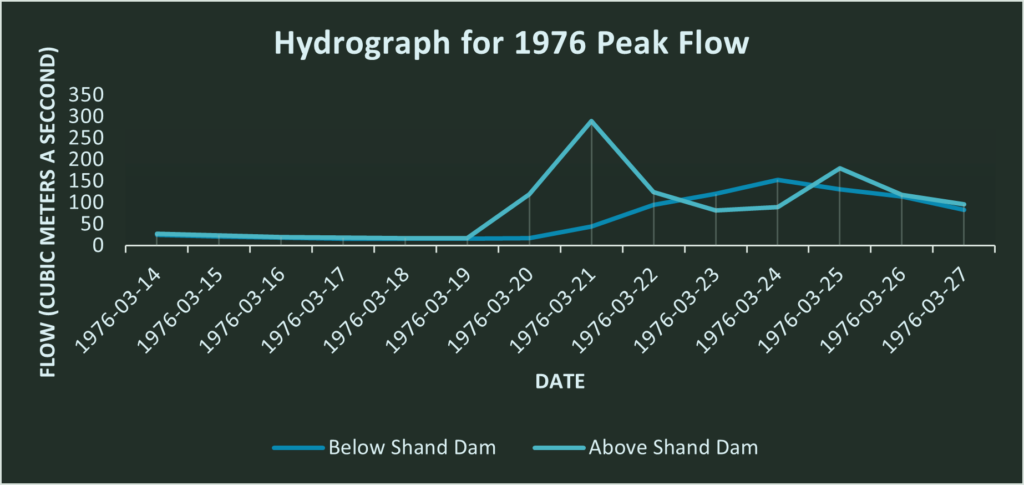
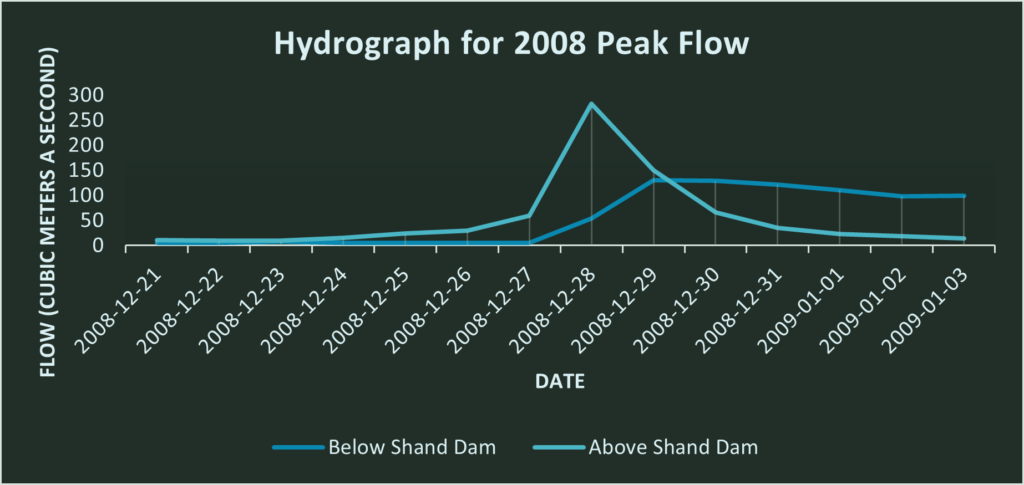
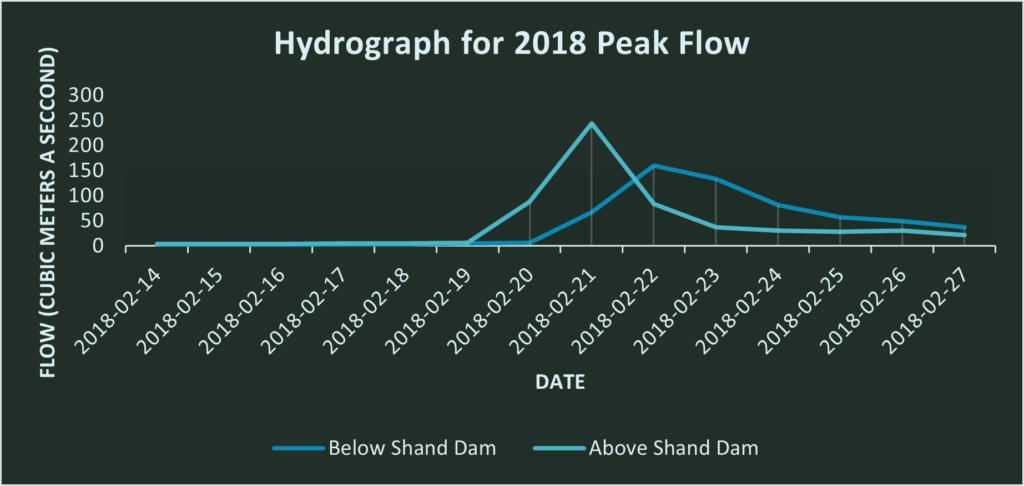
Today, the dam continues to prevent  and lessen the devastation from flooding (especially spring high-flows) through the use of four large gates and three ‘low-flow discharge tubes’ (Baine, 2009).   Dam discharge from dams on the Grand River may continue for some time after the storm is over to regain reservoir storage space and prepare for the next storm  (Grand River Conservation Authority, 2014). This is illustrated in the below hydrographs where the flow above and below the dam is plotted over a time series of one week prior to the peak flow and one week post the peak flow, and the dam delays and ‘flattens’ the peak discharge flow.

Data & Process

This project required two data sources – the hydrometric data for river discharge and a DEM (digital elevation model) from which a 3D printed model will be created. Hydrometric data for the two stations (02GA014 and 02GA016) was downloaded from the Government of Canada, Environment and Natural resources in the format of a .csv (comma separated value) table. Two datasets for hydrometric data were downloaded – the annual extreme peak data for both stations and the daily discharge data for both stations  in date-data format.  The hydrometric data provided river discharge as daily averages in cubic meters a second.   The DEM was downloaded from the Government of Canada’s Geospatial Data Extraction Tool. This website makes it simple and easy to download a DEM for a specific region of canada at a variety of spatial resolutions. I chose to extract my data for the area around Shand Dam that included the hydrometric stations, at a 20 meter resolution (finest resolution available).

3D Printing the DEM

The first step in creating the interactive 3D model was becoming 3D printer certified at Toronto Metropolitan University’s  Digital Media Experience Lab (DME). While I already knew how to 3D print this step was crucial as it allowed me to have access to the 3D printers in the DME for free. Becoming certified with the DME was a simple process of watching some videos, taking an online test, then booking an in person test. Once I had passed I was able to book my prints. The DME has two PRUSA brand printers. These 3D printers require a .gcode file to print models. Initially my data was in a .tiff file, and creating a .gcode file would first involve creating an STL (standard triangle language), then creating a gcode file from the STL. The gcode file acts as a set of ‘instructions’ for the 3D printer.
Exporting the STL with QGIS

First the plugin ‘DEM to 3D print’ had to be installed for QGIS. This plugin creates an STL file from the DEM (tiff). When exporting the digital elevation model to an STL (standard triangle language) file a few constraints had to be enforced.

  • The final size of the STL had to be under 25 mb so it could be uploaded and edited in tinkercad to add holes for the dowels.
  • The final size of the STL file had to be less than ~20cm by ~20cm to fit on the 3D printers bed. 
  • The final .gcode file created from the STL would have to print in under 6 hours to be printed at  the DME. This created a size constraint on the model I would be able to 3D print.

It took multiple experimentations of the QGIS DEM to 3D plugin to create the two STL files that would each print in under 6 hours, and be smaller than 25mb. The DEM was exported as an STL using the plugin and the following settings;

  • The spacing was 0.6mm. Spacing reflects the amount of detail in the STL, and while a spacing of 0.2 mm would have been more suitable for the project it would have created too large of a file to be imported to tinkercad. 
  • The final model size is 6 cm by 25cm and divided into two parts of 6 by 12.5cm. 
  • The model height of the STL was set to 400m, as the lowest elevation to be printed was 401m. This ensured an unnecessarily thick model would not be created. A thick model was to be avoided as it would waste precious 3D printing time.
  • The base height of the model was 2mm. This means that below the lowest elevation an additional 2 mm of model will be created.
  • The final scale of the model is approximately 1:90,000 (1:89,575), with a vertical exaggeration of 15 times. 

Printing with the DME

These STL that were exported from QGIS were opened in PRUSA slicer to create gcode files. The 3D printer configuration of the DME printers were imported and the infill density was set to 10%. This is the lowest infill density the DME will permit, and helps lower the print time by printing a lattice on the interior of the print as opposed to solid fill. Both the gcode files would print in just under 6 hours. 

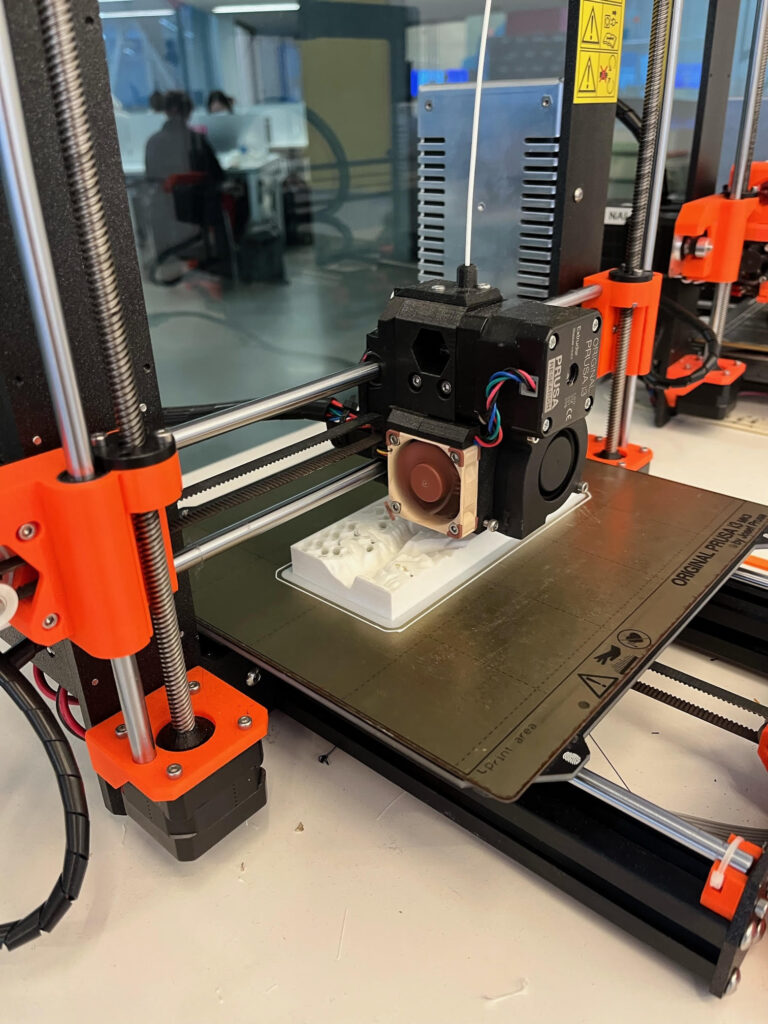
Part one of the 3D elevation model printing in the DME, the ‘holes’ seen in the top are the infill grid.

3D printing the files at the DME proved more challenging than initially expected. When the slots were booked on the website I made it clear that the two files were components of a larger project, however when I arrived to print my two files the 3D printers had two different colors of filament (one of which was a blue-yellow blend). As the two 3D prints would be assembled together I was not willing to create a model that was half white, half blue/yellow. Therefore the second print had to be unfortunately pushed to the following week. At this point I was glad I had been proactive and booked the slots early otherwise I would have been forced to assemble an unattractive model.  The DME staff were very understanding and found humor in the situation,  immediately moving  my second print to the following week so the two files could use the same filament color. 

Modeling Hydrometric Data with Dowels

To choose the days used to display discharge in the interactive model the csv file of annual extreme peak data was opened in excel and maximum annual discharge was sorted in descending order. The top three discharge events at station 02GA014 (above the dam), that would have had data on the same days below the dam  were:

  • 1975-04-19 (average daily discharge of 306 cubic meters a second)
  • 1976-03-21 (average daily discharge of 289 cubic meters a second)
  • 2008-12-28 (average daily discharge of 283 cubic meters a second)

I also chose 2018’s peak discharge event (average daily discharge of 244 cubic meters a second on February 21st) to be included as it was a significant more recent flow event (top 6)

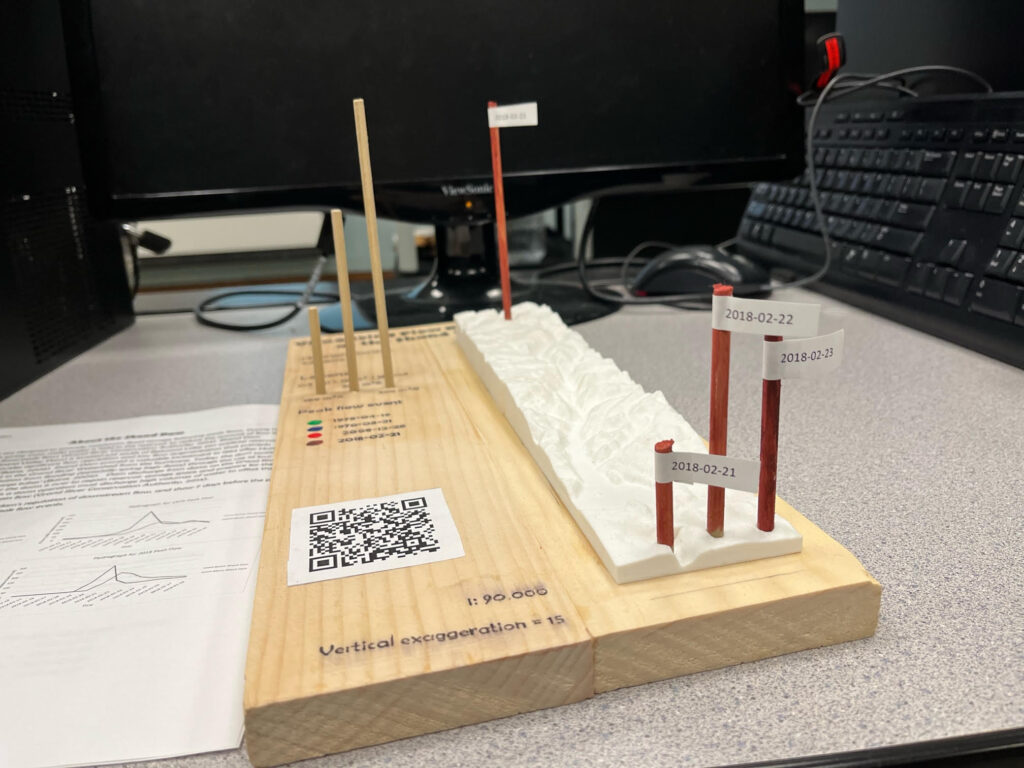
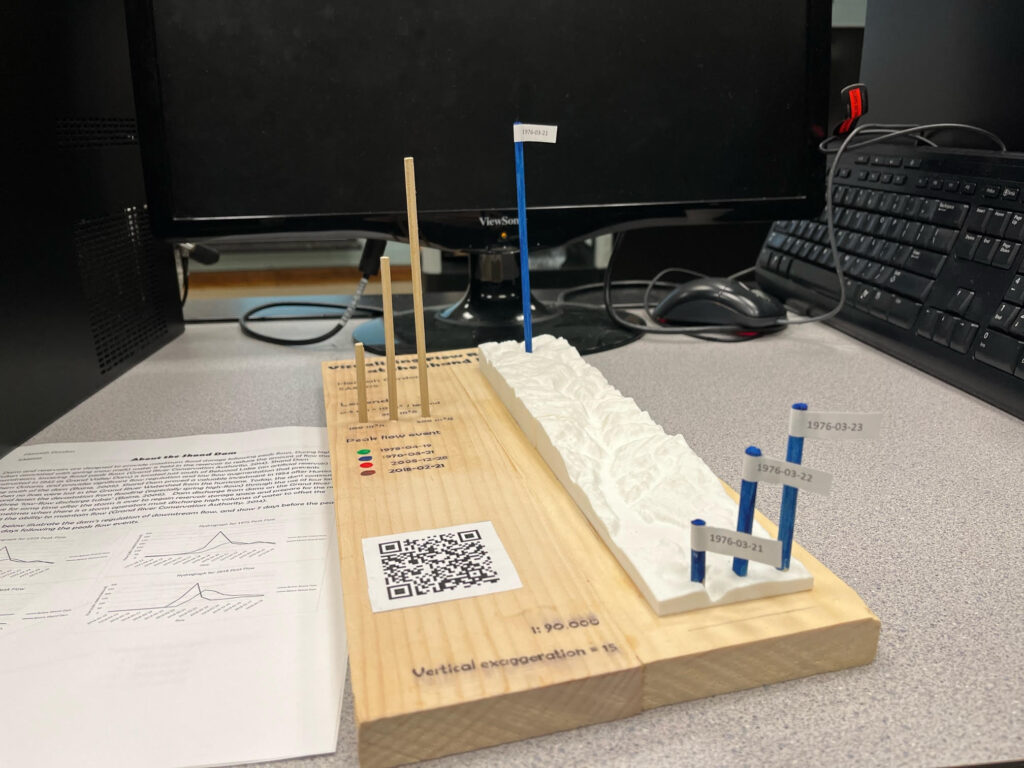
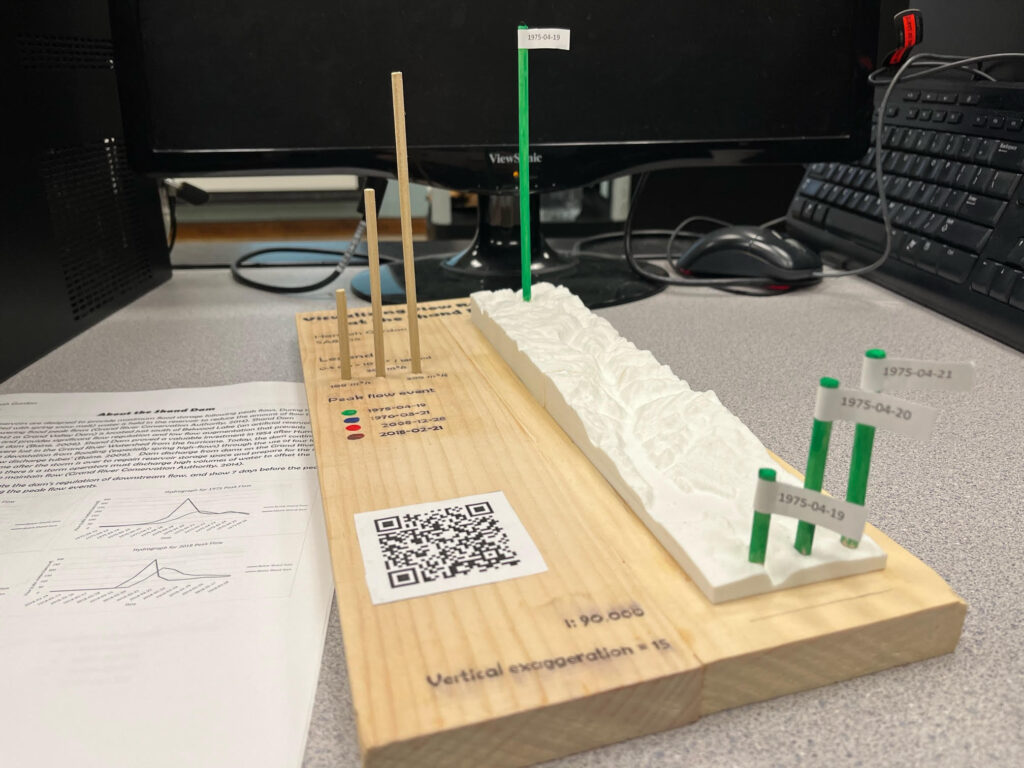
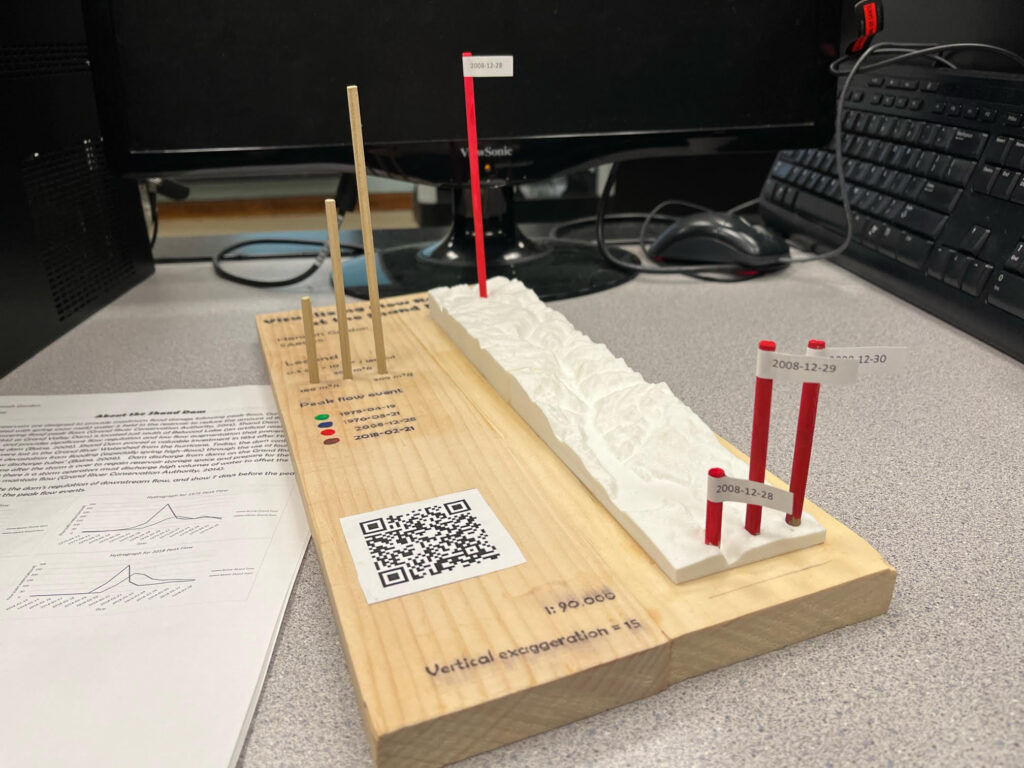
Once the four peak flow events had been decided on, their corresponding data in the daily discharge data were found, and  a scaling factor of 0.05 was applied in excel so I would know the proportional length to cut the dowels. This meant that every 0.5cm of dowel would indicate 10 cubic meters a second of discharge.

As the dowels sit within the 3D print, prior to cutting the dowels I had to find out the depth of the holes in the model. The hole for station 02GA014 (above the dam) was 15mm deep and the holes for station 02GA016 (below the dam) were 75mm deep. This meant that I would have to add 15mm or 75mm to the dowel length to ensure the dowels would accurately reflect discharge when viewed above the model. The dowels were then cut to size, painted to reflect the peak discharge event they correspond to and labeled with the date the data was from. Three dowels for the legend were also cut that reflected discharge of 100, 200, and 300 cubic meters a second. Three pilot holes then three 3/16” holes were drilled into the base for the project (two finished 1 x4’s) for these dowels to sit.

Assembling the Model

Once all the parts were ready the model could be assembled. The necessary information about the project and legend was then printed and carefully transferred to the wood with acetone. Then the base of the 3D print was aggressively sanded to provide better adhesion and glued onto the wood and clamped in place. I had to be careful with this as too tight of clamps would crack the print, but too loose of clamps and the print wouldn’t stay in place as it dried.

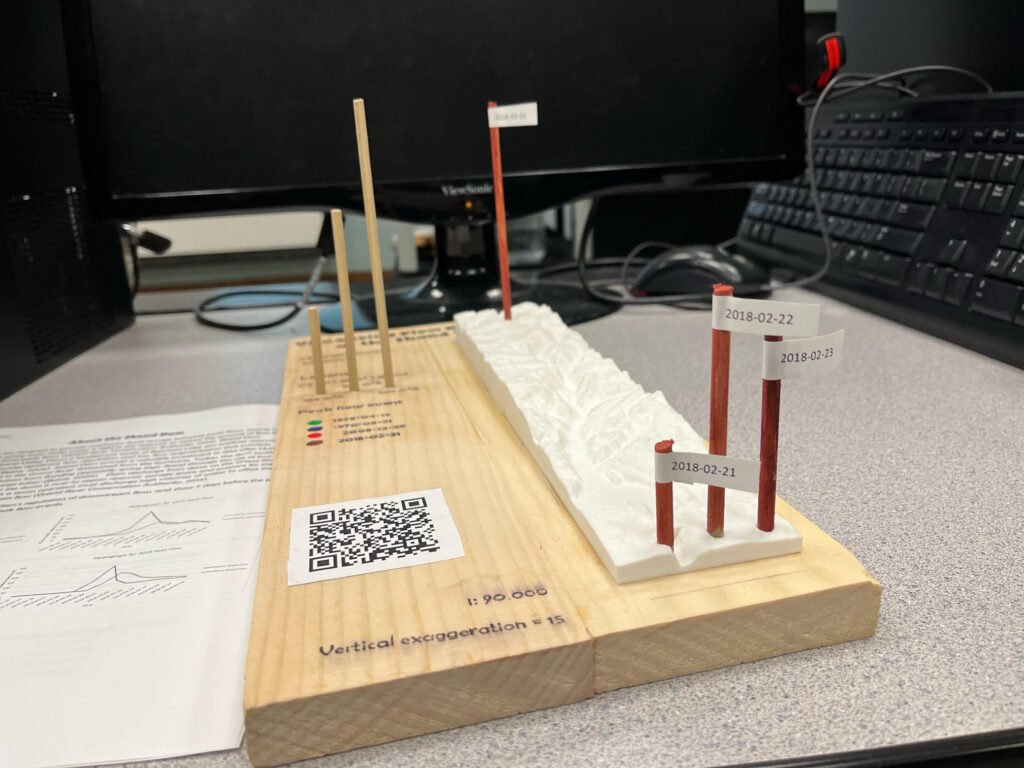
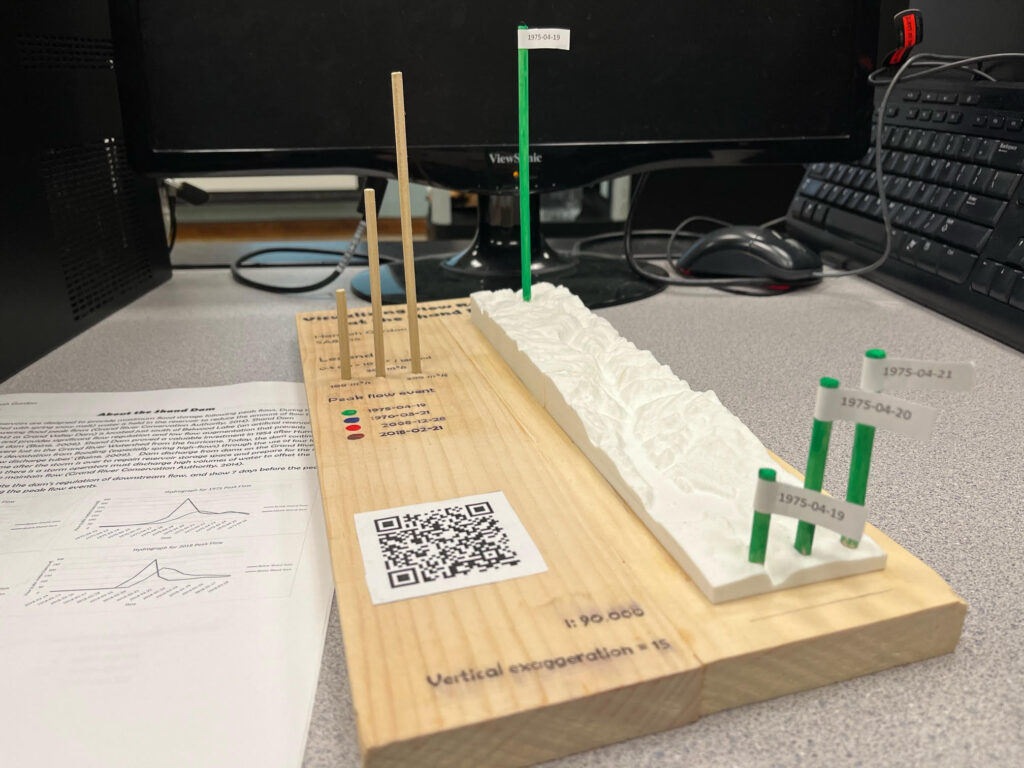
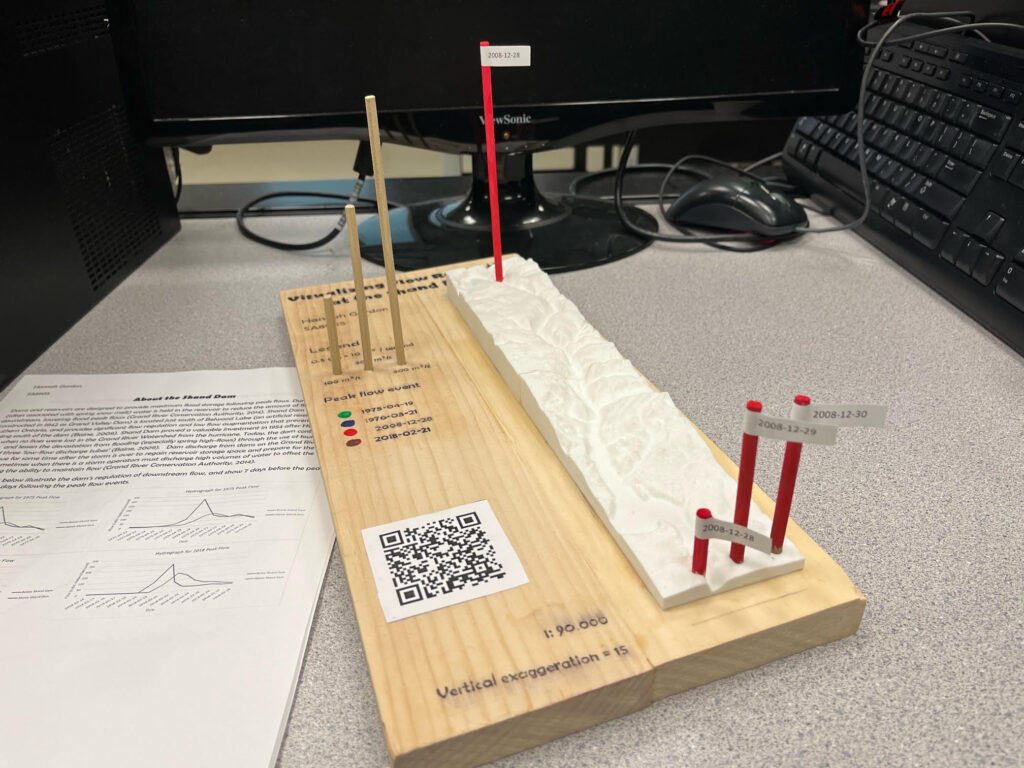
Final model showing 2018 peak flow
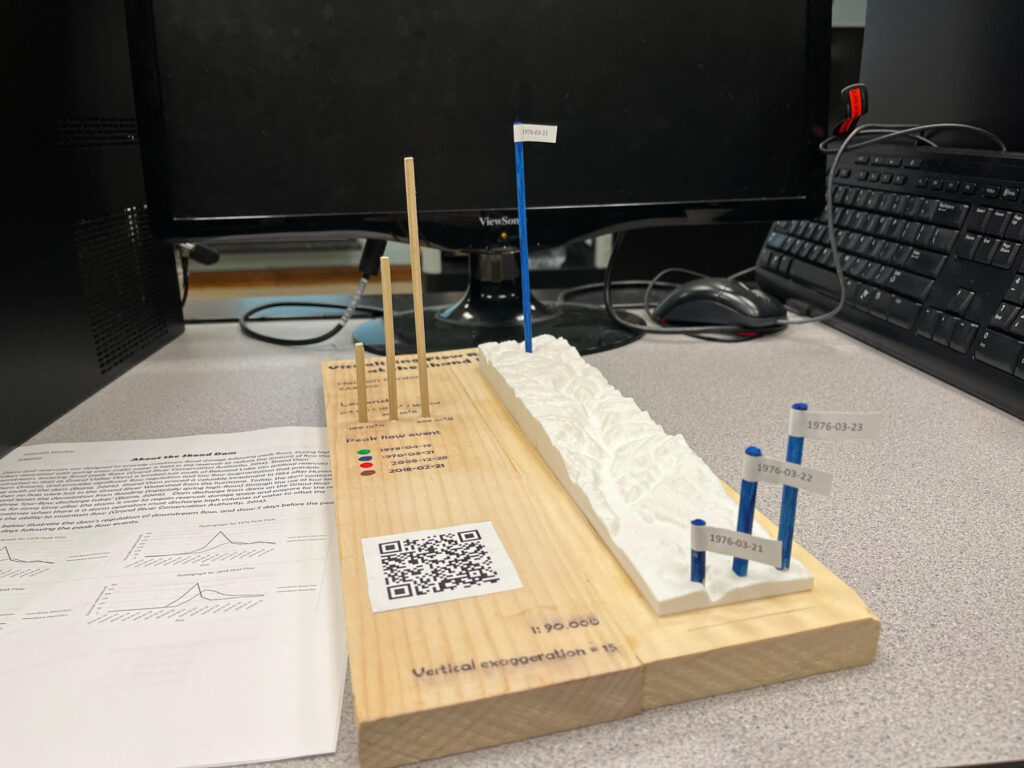
Final model showing 1976 peak flow
Final model showing 1975 peak flow
Final model showing 2008 peak flow

Applications

The finished interactive model allows the visualization of flow regulation from the Shand Dam, for different peak flow events, and highlights the value of this particular dam. Broadly, this project idea was a way to visualize hydrographs, and showed the differences in discharge over a spatial and temporal scale that resulted from the dam. The top dowel shows the flow above the dam for the peak flow event, and the three dowels below the dam show the flow below the dam for the day of the peak discharge, one day after, and two days after, to show the flow regulation over a period of days and illustrate the delayed and moderated hydrograph peak. The legend dowels are easily removable to line them up with the dowels in the 3D print to get a better idea of ow much flow there was on a given day at a given place. The project idea I used in  creating this model can easily be modified for other dams (provided there is suitable hydrometric data). Beyond visualizing flow regulation the same idea and process could be used to create models that show discharge at different stations over a watershed, or over a continuous period of time – such as monthly averages over a year. These models could have a variety of uses such as showing how river discharge changed in response to urbanization, or how climate change is causing more significant spring peak flows from snowmelt. 

References

Baine, J. (2009). Shand Dam a First For Canada. Grand Actions: The Grand Strategy Newsletter. Vol. 14, Issue 2. https://www.grandriver.ca/en/learn-get-involved/resources/Documents/Grand_Actions/Publications_GA_2009_2_MarApr.pdf

Grand River Conservation Authority (2014). Grand River Watershed Water Management Plan. Prepared by the Project Team, Water Management Plan., Cambridge, ON. 137p. + appendices. Retrieved from https://www.grandriver.ca/en/our-watershed/resources/Documents/WMP/Water_WMP_Plan_Complete.pdf

Walker, A. (April 18th, 1942). The dam is 72 feet high, 300 feet wide at the base, and more than a third of a mile long [photograph]. Toronto Star Photograph Archive, Toronto Public Library Digital Archives. Retrieved from https://digitalarchive.tpl.ca/objects/228722/the-dam-is-72-feet-high-300-feet-wide-at-the-base-and-more

Modelling Ontario Butterfly Populations using Citizen Science

Author Name: Emily Alvarez

Data Source: Toronto Entomologists Association (TEA), Statistics Canada

Project Link:

https://public.tableau.com/profile/emily6079#!/vizhome/ModellingOntarioButterflyPopulationsusingCitizenScience/Butterfly_Dashboard?publish=yes

Background:

Over the summer, I spotted multiple butterflies and caterpillars in my garden and became curious about what species may be present in my area and how that might change over time. Originally, I wanted to look at pollinators in general and their populations in Canada, but the data was not available for this. I reached out to the Toronto Entomologists Association (TEA) and fortunately, there was an abundant amount of butterfly population data gathered for the Ontario Butterfly Atlas. This atlas data comes from eButterfly records, iNaturalist records and BAMONA records, as well as records submitted by the public directly to TEA, therefore this data is collected by anyone who wants to submit observations. The organization had an interactive web-map (Figure 1), but this data still had more potential to be designed in a way that can engage both butterfly enthusiasts and the general public.

Figure 1: Ontario Butterfly Atlas Interactive Web Map

Technology

I chose Tableau as the platform to model this data on because it works efficiently with complex databases and large datasets. It is easy to sort and filter the data as well as perform operations (SUM, COUNT) as this was needed for some components of the dashboard. I have used Tableau in the past for simple data visualization but never for spatial data so I felt that using Tableau could be a learning experience as well as improving my skills on a software that I have used in the past.  

Data & Methods:

I consulted with a contact at TEA who provided me with context on the data such as how it is gathered, missing gaps, and the annual seasonal summary on the data. Based on this information and after reviewing the dataset, I felt that there were 3 main components I could model about butterfly species in Ontario. Their location, number of yearly observations and their flight periods for adult populations. Because there was so much data, I focused on 2019 for the locational data and flight periods. There were some inconsistencies with how some of the data was recorded, mostly for number of adults observed since this was not always recorded as a numeric value, therefore any rows that did not have a numeric value were omitted from the dataset.

I chose to model the location of the species by census division because these divisions are not too small in area but are also general enough that it is easy to find the user’s location if they reside in Ontario. This resulted in a spatial join between the observation’s coordinates and the provincial census divisions’ geometry which allowed for a calculation of total sum of adults observed per census division which could also be filtered by species (Figure 2).

Figure 2: Census Division Map of Adult Butterfly Species

I modelled flight periods by month of observation of adult species because this seemed like an efficient way for the user to find when species are in their flight periods (Figure 3). Some enthusiasts may prefer this data to be modelled by month-thirds instead, but I felt that because I wanted this dashboard to be for both butterfly enthusiasts and the general public, I thought modelling by month may be easier for the user to interpret. I decided to also show this by census division because the circle size helps indicate where observations are most popular and how that compares to other census divisions. The user also has a choice to sort by census division and only visualize the flight period for that particular census division.

Figure 3: Flight Period

I modelled yearly observations starting from 2010 because submitted observations began to increase during this time due to more accessibility to online services for submissions, although data exists from the 1800s (Figure 4). This data also could only be filtered by species and not census division because this dataset with all of the observations is too big for the spatial join and caused issues with data extraction that Tableau requires for workbooks to post online.  

Figure 4: Yearly Observations for all Census Divisions

Limitations and Future Work:

  • One of the biggest limitations to this dataset is the lack of observations in the northern regions compared to the southern. Because there is a lower population and less accessibility to a lot of areas, there are few submitted observations here, therefore the dataset does not capture the whole picture of Ontario.
  • Another limitation is that because this is citizen science-based data, there is some inconsistency with some data entry, as an example, the Adult populations were not always recorded numerically but sometimes with text or unclear values such as “a few, many, >100” which resulted in these observations not being modelled because they could not be properly quantified.
  • Another limitation is that the yearly observations cannot be sorted by census division. Because this contains such a large dataset, to conduct the spatial join with the census division polygons caused issues with data extraction and publishing the workbook. Therefore, this component can only be sorted by species.
  • The last biggest limitation to the dashboard is the way flight periods are modelled. Butterfly enthusiasts may prefer to look at flight periods within a smaller scale than months and prefer month-thirds. A future addition to this dashboard could include a toggle that allows you to switch between looking at flight period by month or month-thirds instead.

Geovisualization of the York Region 2018 Business Directory


(Established Businesses across Region of York from 1806 through 2018)

Project Weblink (ArcGIS Online): Click here or direct weblink at https://ryerson.maps.arcgis.com/apps/opsdashboard/index.html#/82473f5563f8443ca52048c040f84ac1

Geovisualization Project @RyersonGeo
SA8905- Cartography and Geovisualization, Fall 2020
Author: Sridhar Lam

Introduction:

York Region, Ontario as identified in Figure 1, with over one million people from a variety of cultural backgrounds is across 1,776 square kilometres stretching from Steeles Avenue in the south to Lake Simcoe and the Holland Marsh in the north. By 2031, projections indicate 1.5 million residents, 780,000 jobs, and 510,000 households. Over time, York Region attracted a broad spectrum of business activity and over 30,000 businesses.

Fig.1: Region of York showing context within Ontario, Greater Toronto Area (GTA) and its nine Municipalities.
(Image-Sources: https://www.fin.gov.on.ca/en/economy/demographics/projections/ , https://peelarchivesblog.com/about-peel/ and https://www.forestsontario.ca/en/program/emerald-ash-borer-advisory-services-program)

Objective:

To create a geovisualization dashboard for the public to navigate, locate and compare established Businesses across the nine Municipalities within the Region of York.

The dashboard is intended to help Economic Development market research divisions sort and visualize businesses’ nature, year of establishment (1806 through 2018), and identify clusters (hot-spots) at various scales.

Data-Sources & References:

  1. Open-Data York Region
  2. York Region Official Plan 2010

Methodology:

First, the Business Directory updated as of 2018, and the municipal boundaries layer files, which are made available at the Open-Data Source of York Region, are downloaded. As shown in Figure 2, the raw data is analyzed to identify the Municipal data based on the address / municipal location distribution. It is identified that the City of Markham and the City of Vaughan have a major share.

Fig.2: The number of businesses and the percentage of share within the nine Municipalities of the York Region.

The raw-data is further analyzed, as shown in Figure 3, to identify the major business categories, and the chart below presents the top categories within the dataset.

Fig.3: Major Business Categories identified within the dataset.

Further, the raw data is analyzed, as shown in figure 4, to identify the businesses by the year of establishment, and identifies that most of the businesses within the dataset were established after the 1990s.

Fig 4: Business Establishment Years identified within the dataset.

The Business addressed data is checked for consistency, and Geocodio service is used to geocode the address list for all the business location addresses. The resulting dataset is imported into ArcGIS Map, as shown in figure 5, along with the municipal boundaries layers and checked for inconsistent data before being uploaded onto ArcGIS Online as hosted layers.

Fig.5: Business Locations identified after geocoding of the addresses across the York Region.

Once hosted on ArcGIS Online, a new dashboard titled: ‘Geovisualization of the York Region 2018 Business Directory’ is created. To the dashboard, the components are tested for visual hierarchy, and careful selection is made to use the following components to display the data:

  1. Dashboard Title
  2. Navigation (as shown in figure 6, is placed on the left of the interface, which provides information and user-control to navigate)
  3. Pull-Down/ Slider Lists for the user to select and sort from the data
  4. Maps – One map to display the point data and the other to display cluster groups
  5. Serial Chart (List from the data)- To compare the selected data by the municipality
  6. Map Legend, and
  7. Embedded Content – A few images and videos to orient the context of the dashboard

The user is given a choice to select the data by:

Fig.6: User interface for the dashboard offering selection in dropdown and slider bar.

Thus a user of the dashboard can select or make choices using one or a combination of the following to display the results in on the right panes (Map, data-chart and cluster density map):

  1. Municipality: By each or all Municipalities within York Region
  2. Business Type: By each type or multiple selections
  3. Business Establishment Year Time-Range using the slider (the Year 1806 through 2018)

For the end-user of this dashboard, results are also provided based on business locations identified after geocoding the addresses across the York Region, comparative and quantifiable by each of the nine municipalities shown in Figure 7.

Fig.7: Data-Chart displayed once the dashboard user makes a selection.

By plotting the point locations on a map, and simultaneously showing the clusters within the selected range (Region/ by Municipality / by Business Type / Year of Establishment selections), Figure 8.

Fig.8: Point data map and cluster map indicate the exact geolocation as well as the cluster for the selection made by the user across the York Region at different scales.

Results:

Overall, the dashboard provides an effective geovisualization with a spatial context and location detail of the York Region’s 2018 businesses. The business type index with an option to select one/ multiple at a time and the timeline slider bar offers an end-user of the dashboard to drill down to the information they seek to obtain from this dashboard. The dashboard design offers a dark theme interface maintaining a visual hierarchy of the different map elements such as the map title, legend, colour scheme, colour combinations ensuring contrast and balance, font face selection and size, background and map contrast, choice of hues, saturation, emphasis etc. The maps also offer the end-user to change the background map base layers to see the data in the context of their choice. As shown in figure 9 of location data and quantifiable data at different scales, the dashboard interface offers visuals to display the 30,000+ businesses across the York Region.

This image has an empty alt attribute; its file name is Capture-1-1024x496.jpg

Fig.9: Geovisualization Dashboard to display the York Region 2018 Business Directory across the Nine Municipalities of the York Region.

The weblink to access the ArcGIS Online Dashboard where it is hosted is: https://ryerson.maps.arcgis.com/apps/opsdashboard/index.html#/82473f5563f8443ca52048c040f84ac1

(Please note an ArcGIS Online account is required)

Limitation:

The 2018 business data across York Region contains over 38,000 data points, and the index/ legend of the business types may look cluttered while a selection is made as well. The fixed left navigation panel width is definitely a technical limitation because the pull-down display cannot be made wider. However, the legend screen could be maximized to read all the business categories clearly. There may be errors, incomplete or missing data in the compilation of business addresses. This dashboard can be updated quickly but requires a little effort, whenever there is an update of the York Region business directory’s new release in the coming years.

Ontario Demographics Data Visualization

Introduction

The purpose of this project is to visualize any kind of data on a webmap. Using open source software, such as QGIS, solves one aspect of this problem. The other part of this problem is to answer this question:

How and what data can be visualized? Data can be stored in a variety of formats, and organized differently. The most important aspect of spatial data is the spatial information itself and so we need to figure out a way to display the data using textual descriptions, symbols, colours, etc. at the right location.

Methodology

In this visualization, I am using the census subdivisions (downloaded from Statstics Canada website) as the basic geographical unit, plus the 2016 census profile for the census subdivisions (also downloaded from Statistics Canada website). Once these data were downloaded, the next steps were to inspect the data and organize them in a fashion so that they could be easily visualized by the shapefiles. In order to facilitate this task, we can use any relational database management system, however, my preference was to use SQL Server 2017 express edition. Once the 2016 census profile has been imported into SQL Server, the “SQL Queries” [1] file can be run to organize the data into a relational table that can be exported, or copied directly from the result-set on management studio and pasted, into excel/csv; the sheet/file can now be opened in QGIS and joined to the shapefile of Ontario Census Subdivisions [2] using CSDUID as the common field between the two files.

Using the qgis2web plugin, all data and instructions are manually chosen on a number of tabs. You can choose the layers and groups you want to upload, and then customize the appearance and interactivity of the webmap based on available options. There is the option to use either Leaflet, or OpenLayers styles on QGIS version 3.8. You can Update preview and see what the outcome will look like. You can then Export the map and the plugin will convert all the data and instructions into json format. The most important file – index.html – is created on the directory you have specified.

index.html [1] is the file that can be used to visualize the map on the web browser, however, you need to first download all the files and folders from the source page [1]. This will put all the files on your (client) machine which makes it possible to open index.html on localhost. If the map files are uploaded on a web server, then the map can be viewed by the world wide web.

Webmap

The data being visualized belongs to the population demographics (different age groups). The map of Ontario’s census subdivisions is visualized as a transparent choropleth map of 2016 population density. Other pieces of demographics information are embedded within the pop-up for each of the census subdivisions. If you hover your cursor on each of the census subsivisions, it will be highlighted with a transparent yellow colour so you can see the basemap information on the basemap clearer. If you click on them, the pop-up will appear on the screen, and you can scroll through it.

There are other interactive utilities on the map such as controllers for zooming in and out, a (ruler) widget to make measurements, a (magnifying glass) widget to search the entire globe, a (binocular) widget to search only the layers uploaded on the map, and a (layers) widget to turn layers and basemaps on and off.

Limitations

There are some limitations that I encountered after I created this webmap. The first, and most important limitation, is the projection of the data on the map. The original shapefile was using the EPSG code of 3347 which uses the Canada Lambert Conic projection with NAD 1983 datum. The plugin converted data into the most common web projection format, WGS 1984, which is defined globally by Longitude and Latitude. Although WGS 1984 prevents the hassle of using projected coordinate systems by using one unified geographic projection for the entire globe, nevertheless, it distorts the shapes as we move farther away from the equator.

The second limitation was the fact that my transparent colours were not coded into the index.html file. The opacities are defined as 1. In order to control the level of opacities, the index.html file must be opened in a text editor, the opacities changed to the proper levels, ranging between 0 and 1, and lastly save the edits on the same index.html file.

The next limitation is the size of files that can be uploaded on github [3]. There is a limit of 100 MB on the files that can be uploaded to github repositories, and because the size of the shapefile for entire Canadian census subdivisions is over 100 MB, when converted to json, it could not be uploaded to the repository [1] with all the other files. However, it is possible to add to geojson formatted file (of census subdivisions) to the data directory of the repository on the localhost machine, and manually add its location with a pair of opening and closing script tags on the index.html file on the body tag. In my case, the script was:

<script src=”data/CensusSubdivisions_4.js“></script>

The name of the file should be introduced as the very beginning line of the geojson file as a variable:

var json_CensusSubdivisions_4 = {

And don’t forget that the last line should be a closing curly braces:

}

Now index.html is aware where to find the data for all of the Canadian census subdivisions.

What’s Next?

To conclude with the main goal of this project, which was stated in the introduction, we now have a framework to visualize any data we want. Which data we want to visualize should change our methodology becasuase the scripts can be adapted accordingly. What is more important is the way we want the data to be visualized on the webmap. This tutorial presented the basics of qgis2web plugin. Once the index.html file is generated, other javascript libraries can be added to this file, and depending on your level of comfort with javascript you can expand and go beyond the simple widgets and utilities on this webmap.

  [1]  https://github.com/Mahdy1989/GeoVisualization-Leaflet-Webmap/tree/master  

 [2] There is a simple way to limit the extent of the census subdivisions for the entire Canada, to the Ontario subset only: filter the shapefile by PRUID = '35' which is the code for Ontario.

[3]  https://help.github.com/en/github/managing-large-files/what-is-my-disk-quota 

Invasive Species in Ontario: An Animated-Interactive Map Using CARTO

By Samantha Perry
Geovis Project Assignment @RyersonGeo, SA8905, Fall 2018

My goal was to create an animated time-series map using CARTO to visualize the spread of invasive species across Ontario. In Ontario there are dozens of invasive species posing a threat to the health of our lakes, rivers, and forests. These intruding species can spread quickly due to the absence of natural predators, often damaging native species and ecosystems, and resulting in negative effects on the economy and human health. Mapping the spread of these invasive species is beneficial for showing the extent of the affected areas which can potentially be used for research and remediation purposes, as well as awareness for the ongoing issue. For this project, five of the most problematic or wide-spread invasive species were included in an animated-interactive map to show their spatial and temporal distribution.

The final animated-interactive map can be found at: https://perrys14.carto.com/builder/7785166c-d0cf-41ac-8441-602f224b1ae8/embed

Data

  1. The first dataset used was collected from the Ontario Ministry of Natural Resources and Forestry and contained information on invasive species observed in the province from 1982 to 2012. The data was provided as a shapefile, with polygons representing the affected areas.
  2. The second dataset was downloaded from the Early Detection & Distribution Mapping System (EDDMapS) Ontario website. The dataset included information about invasive species identified between 2010 and 2018. I obtained this dataset to supplement the Ontario Ministry dataset in order to provide a more up-to-date distribution of the species.

Software
CARTO is a location-intelligence based website that offers easy to use mapping and analysis software, allowing you to create visually appealing maps and discover key insights from location data. Using CARTO, I was able to create an animated-interactive map displaying the invasive species data. CARTO’s Time-Series Widget can be used to display large numbers of points over time. This feature requires a map layer containing point geometries with a timestamp (date), which is included in the data collected for the invasive species.

CARTO also offers an interactive feature to their maps, allowing users control some aspects of how they want to view the data. The Time-Series Widget includes animation controls such as play, stop, and pause to view a selected range of time. In addition, a Layer Selector can be added to the map so the user is able to select which layer(s) they wish to view.

Limitations
In order to create the map, I created a free student account with CARTO. Limitations associated with a free student account include a limit on the amount of data that can be stored, as well as a maximum of 8 layers per map. This limits the amount of invasive species that can be mapped.

Additionally, only one Time-Series Widget can be included per map, meaning that I could not include a time-series animation for each species individually, as I originally intended to. Instead, I had to create one time-series animation layer that included all five of the species. Because this layer included thousands of points, the map looks dark and cluttered when zoomed out to the full extent of the province (Figure 1). However, when zoomed in to specific areas of the province, the points do not overlap as much and the overall animation looks cleaner.

Another limitation to consider is that not all the species’ ranges start at the same time. As can be seen in Figure 1 below, the time slider on the map shows that there is a large increase in species observations around 2004. While it is possible that this could simply be due to an increase in observations around that time, it is likely because some of the species’ ranges begin at that time.

Figure 1. Layer showing all five invasive species’ ranges.

Tutorial

Step 1: Downloading and reviewing the data
The Ontario Ministry of Natural Resources and Forestry data was downloaded as a polygon shapefile using Scholars GeoPortal, while the EDDMapS Ontario dataset was downloaded as a CSV file from their website.

Step 2: Selection of species to map
Since the datasets included dozens of different invasive species in the datasets, it was necessary to select a smaller number of species to map. Determining which species to include involved some brief research on the topic, identifying which species are most prevalent and problematic in the province. The five species selected were the Eurasian Water-Milfoil, Purple Loosestrife, Round Goby, Spiny Water Flea, and Zebra Mussel.

Step 3: Preparing the data for upload to CARTO
Since the time-series animation in CARTO is only available for point data, I had to convert the Ontario Ministry polygon data to points. To do this I used ArcMap’s “Feature to Point” tool which created a new point layer from the polygon centroids. I then used the “Add XY Coordinates” tool to get the latitude and longitude of each point. Finally, I used the “Table to Excel” conversion tool to export the layer’s attribute table as an excel file. This provided me with a table with all invasive species point data collected by the Ontario Ministry that could be uploaded to CARTO.

Next, I created a table that included the information for the five selected species from both sources. I selected only the necessary columns to include in the new table, including; Species Name, Observation Date, Year, Latitude, Longitude, and Observation Source. This combined table was then saved as an excel file to be uploaded to CARTO.

Finally, I created 5 additional tables for each of the species separately. These were later used to create map layers that show each species’ individual distribution.

Step 4: Uploading the datasets to CARTO
After creating a free student account with CARTO, I uploaded the six datasets as excel files. Once uploaded, I had to change the “Observation Date” column from a “string” to “date” data type for each dataset. A “date” data type is required for the time-series animation to run.

Step 5: Geocoding datasets
Each dataset added to the map as a layer had to be geocoded. Using the latitude and longitude columns previously added to the Excel file, I geocoded each of the five species’ layers.

Step 6: Create time-series widget to display temporal distribution of all species
After creating a blank map, I added the Excel file that included all the invasive species data as a layer. I then added a Time-Series Widget to allow for the temporal animation. I then selected Observation Date as the column to be displayed, meaning that the point data will be organized by observation date. I chose to organize the buckets, or groupings, for the corresponding time-slider by year.

Since “cumulative” was not an option for the Time-Series layer, I had to use CARTCSS to edit the code for the aggregation style. Changing the style from “linear” to “cumulative” allowed the points to remain on the screen for the duration of the animation, letting the user see the entire species’ range in the province. The updated CSS code can be seen in the screenshots below.

Step 7: Creating five additional layers for each species’ range
Since I could only add one Time-Series Widget per map, and the layer with the animation looks cluttered at some extents, I decided to create five additional layers that show each of the species’ individual observation data and range.

Step 8: Customizing layer styles
After adding all of the layers, a colour scheme was selected where each of the species’ was represented by a different colour to clearly differentiate between them. Colours that are generally associated with the species were selected. For example, the colour purple was selected to represent Purple Loosestrife, which is a purple flowering plant. The “multiply” style option was selected, meaning that areas with more or overlapping occurrences of invasive species are a darker shade of the selected colour.

A layer selector was included in the legend so that users can turn layers on or off. This allows them to clearly see one species’ distribution at a time.

Step 9: Publish map
Once all of the layers were configured correctly, the map was published so it could be seen by the public.

Using LEGO to create a physical 3D elevation model of Ontario

by: Adam Anthony | Geovis Project Assignment @RyersonGeo, SA8905, Fall 2018

Using LEGO blocks to visualize the landscape elevation throughout the province of Ontario was an the objective of this project and the steps I took to execute this project will be outlined below.

I first sourced the elevation data from Scholar’s GeoPortal and used the north and south PDEM files for Ontario as the foundation for the elevation model. Using ArcGIS I added the north and south PDEM layers and merged the two files using Mosaic To New Raster tool. This produced a merged PDEM.

Next, the merged PDEM needed to be resampled, to increase the pixels size so that it would align with the size of a 1×1 LEGO block. Using the Resample tool, I resampled the pixel size from 30x30m to 30,000×30,000m resolution. This resolution was influenced by a number of factors:

  1. maintaining the integrity of the elevation levels (699m was the highest peak at 30x30m, but it reduced to 596m when resampled to 30kx30k)
  2. scale of physical model as it relates to size and cost of the LEGO blocks

Below is the resampled layer to 30k resolution and clipped to a raster tiff of Ontario (also at same resolution)

In the Properties dialiogue box I converted the Stretched symbology to Classificled symbology which would allow me to isolate specific elevation interval classes. I seleccted seven classes based on the following criteria:

  1. Wanted to isolate the high and low values
  2. Using intervals of 75m depicted the more visually appealling variation in elevation and did so most effectively. It allowed for a <75m and a >450m class
  3. No more than seven classes because of LEGO colour options and available stock
  4. Equal interval of 75m increments

Colour selection at this stage was preliminary and a divergent scheme from green to dark burgundy seemed to be most aesthetically pleasing.

To isolate each elevation layer to determine the number of pixels (i.e. LEGO blocks) each layer requires the raster layer had to be converted to a vector layer.

Using Raster Calculator and the Int Tool, I converted the current raster from a float to an integer raster layer which is needed to be done to convert raster to polygon. This converted each cell value of the raster to an integer.

This new raster file was then converted to a polygon layer using the Raster to Polygon tool, creating this output.

Activating the raster layer from a previous step, I was able to then manually select each pixel for each respective layer to determine the number of pixels (ie LEGO pieces) that comprised the layer.

Each pixel was selected using the Selection tool and then onces all pixels for the appropriate layer were selected, the Create Layer from Selected Features was used to create an individual layer for each elevation level.

This process was repeated 7 times, producing 7 layers of elevation. Each layer’s Attribute Table was then used to identify the total number of pixels present in the layer and then was used to determine the number of LEGO pieces needed for that layer, where 1 pixel = 1 single-block LEGO piece.

These individual layers will also be used during the build, as a guideline for the distribution and placement of each LEGO piece.

Each colour class is an individual layer. Colours are still preliminary and the number of LEGO pieces per layer is as follows:

  • <75m: 1089 pcs
  • 75-150m: 987 pcs
  • 150-225m: 809 pcs
  • 225-300m: 657 pcs
  • 300-375m: 455 pcs
  • 375-450m: 221 pcs
  • >450m: 51 pcs

Using BrickLink, I was able to purchase 1×1 LEGO bricks for each layer. Factors that influenced the colour selection for each layer are as follows:

  • Quantity of colour available
  • Price of individual bricks
  • Location of supplier (North American)

The resulting colour scheme selected is a divergent scheme, as follows:

  • <75m: dark green
  • 75-150m: medium grey
  • 150-225m: light green
  • 225-300m: tan
  • 300-375m: light lavender
  • 375-450m: medium lavender
  • >450m: dark purple

Here is the final product.

Here is a time lapse video of the LEGO build:

https://www.youtube.com/watch?v=RP6PxkPlK1w&feature=youtu.be

HexBinning Ontario

By Andrew Thompson – Geovis course project, SA8905 (Dr. Rinner)

The power of data visualization is becoming increasingly more robust and intricate in nature. The demand to deliver a variety of complex information has lead to the development of highly responsive visual platforms. Libraries such as d3 are providing increased flexibility to work along multiple web technology stacks (HTML, CSS, SVG) allowing for nearly unlimited customization and capacity to handle large datatypes.

hexbin

In this development, a combination of d3 and Leaflet is used to provide a data-driven visualization within an easy to use mapping engine framework; made possible through the developments of Asymmetrik.  This collection of plugins, has allowed the creation of dynamic hexbin-based heatmaps and dynamically update/visualize transitions.

The web mapping application is avaiable at: HexBinning Ontario

Discussion of data & techniques follows below…

Continue reading HexBinning Ontario