By Matthew Cygan
GeoVis Project Assignment, TMU Geography, SA8905, Fall 2025
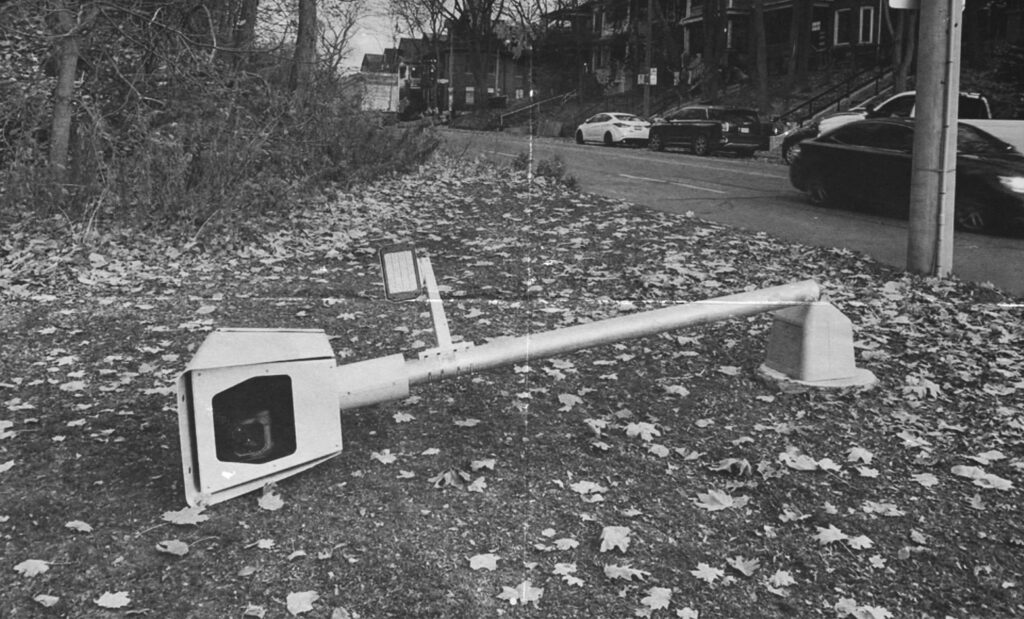
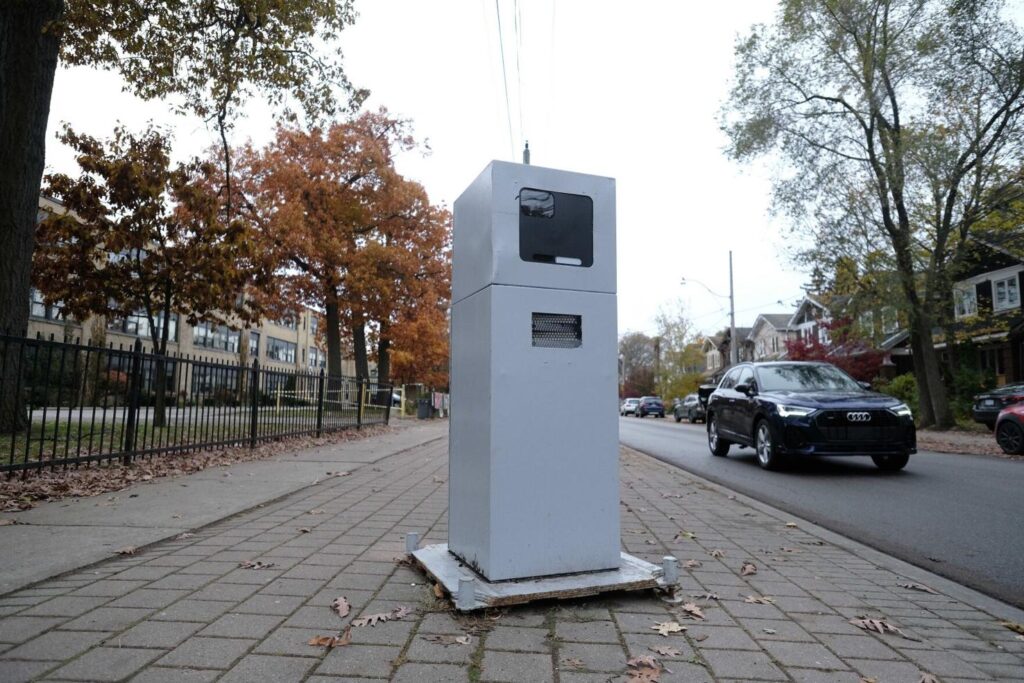
Introduction: Gone But Never Forgotten
Five days ago, on November 14, 2025, Ontario’s automated speed enforcement program ended¹. At midnight, all 150 of Toronto’s speed cameras stopped issuing tickets, closing a controversial five-year chapter in the city’s traffic safety infrastructure. Between January and August 2025 alone, these cameras issued 550,997 tickets and collected over $30 million². Since July 2020, they generated millions in revenue while reducing speeding in school zones by 45%³.
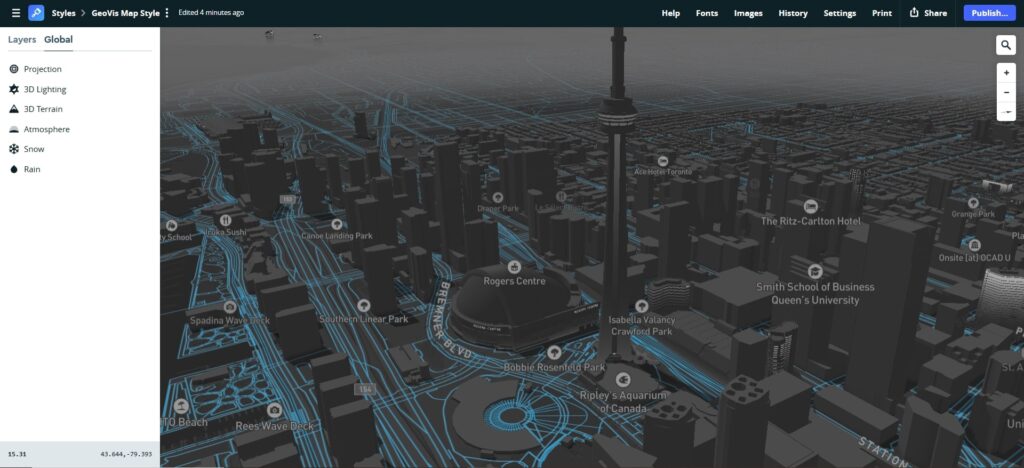
This memorial blog will aim to preserve the good memories. The result is a digital memorial: a 3D interactive web map documenting 198 speed camera locations across Toronto’s 25 wards, built with Mapbox GL JS and custom JavaScript. This map highlights geographic and temporal features along with the volume of tickets issued to drivers!
Users can scroll to zoom and hold Ctrl/Cmd and drag to rotate and tilt for 3D view
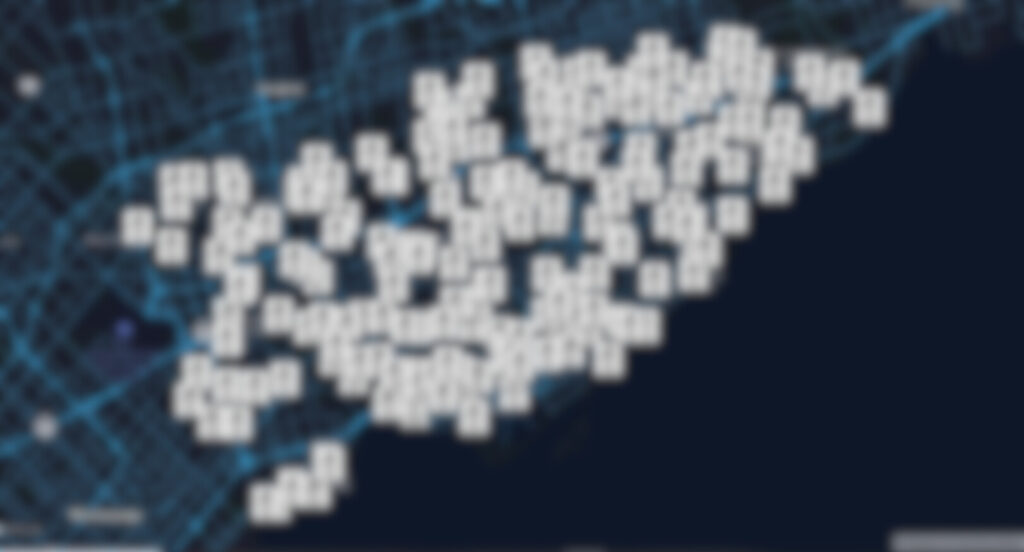
Preview
Context: The Automated Speed Camera Program and Its Ban
The automated speed enforcement program began in July 2020 after the provincial government enabled municipalities to deploy cameras⁴. By November 2022, Toronto had issued 560,000 tickets and collected $34 million⁵. The city expanded from 75 to 150 cameras in March 2025, using data-driven placement to target areas with speeding and collision histories⁷.
Despite some data indicating effectiveness (45% reduction in school zone speeding³, 87% reduction in vehicles exceeding limits by 20+ km/h⁹), Premier Doug Ford announced a provincial ban in September 2025, calling the cameras a “cash grab”⁸. The ban took effect November 14, 2025¹.
Consequences:
- Potential layoff of 1,000 Toronto workers¹⁰
- Loss of $30+ million in annual revenue¹⁰
- Removal of all active 150 cameras and infrastructure
- Provincial funding of $42 million deemed insufficient by city leaders¹⁰
Data Sources and Data Management
The project combines datasets from the City of Toronto’s Open Data Portal¹¹:
- Speed Camera Locations (GeoJSON)
- Monthly Charge Data (July 2020 to November 2025)
The Data Management Problem:
The biggest challenge was joining the location and charge datasets by my only linking variable: address. Unfortunately, both had a plethora of inconsistencies in address formats:
- Random double spaces: “Kipling Ave.” vs “Kipling Ave.”
- Period inconsistencies: “St.” vs “St”
- Abbreviation differences: “W” vs “West”, “Dr” vs “Drive”
- Directional contradictions: Same location described as “south of X” in one dataset, “north of Y” in another
The final dataset contains 198 documented locations, though some have incomplete enforcement data.
This experience showed me that real-world public datasets are messy. Data cleaning is often the most time-consuming part of any GIS project.
Building the Memorial Map
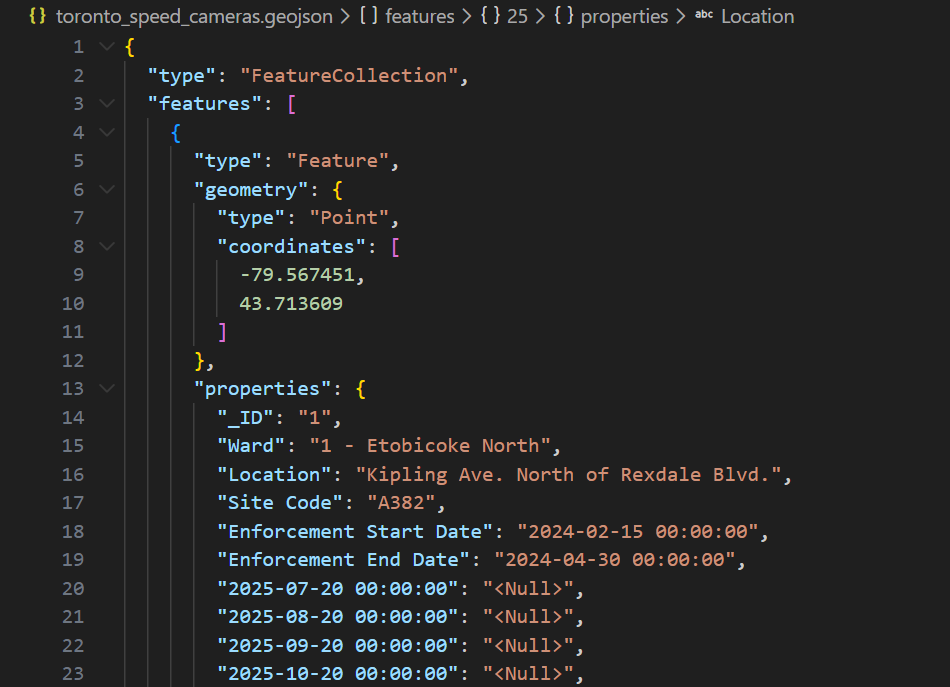
Step 1: GeoJSON Structure
All Speed Camera XY coordinates were exported to GeoJSON format to make the locations readable by JavaScript:
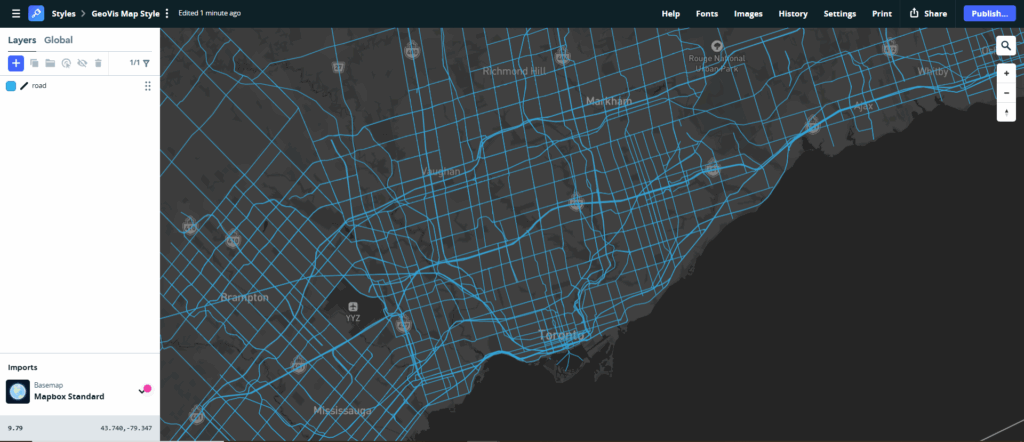
Step 2: Custom Basemap
I designed a custom basemap in Mapbox Studio that displayed a visually appealing and cartographically sound map:
- Grayscale base colors creating a neutral and smooth background
- Blue roads for road infrastructure clarity and visual harmony
- Minimal labels with clean typography creating a modern aesthetic
Step 3: Adding 3D Terrain
Late in development, I added Mapbox’s 3D terrain feature using the Terrain-DEM v1 tileset¹². This transformed the user experience:
- Users can hold Ctrl/Cmd and drag to rotate and tilt the view
- 3D visualization reveals how cameras are positioned in space and provides more real world context
Step 4: Bringing the Interactive Map to Life
Getting the interactive web map functional required three main files working together: the GeoJSON data, the HTML file, and the CSS styling.
The toronto_speed_cameras.geojson file, as seen in the image in Step 1, contains the coordinates and details for all 198 camera locations. Each camera is a Point feature with properties like ward, location name, site code, and enforcement dates. The JavaScript reads this file to position markers and populate the interactive popups.
The index.html file is the backbone. It sets up the page structure, loads the Mapbox GL JS library, and links everything together. JavaScript embedded in the HTML initializes the map and handles the interactive features.
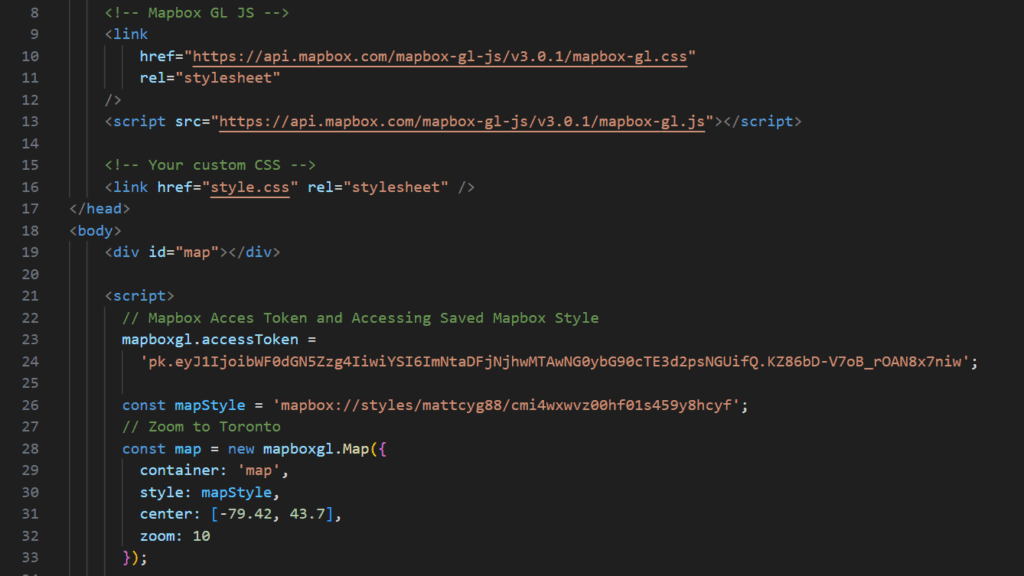
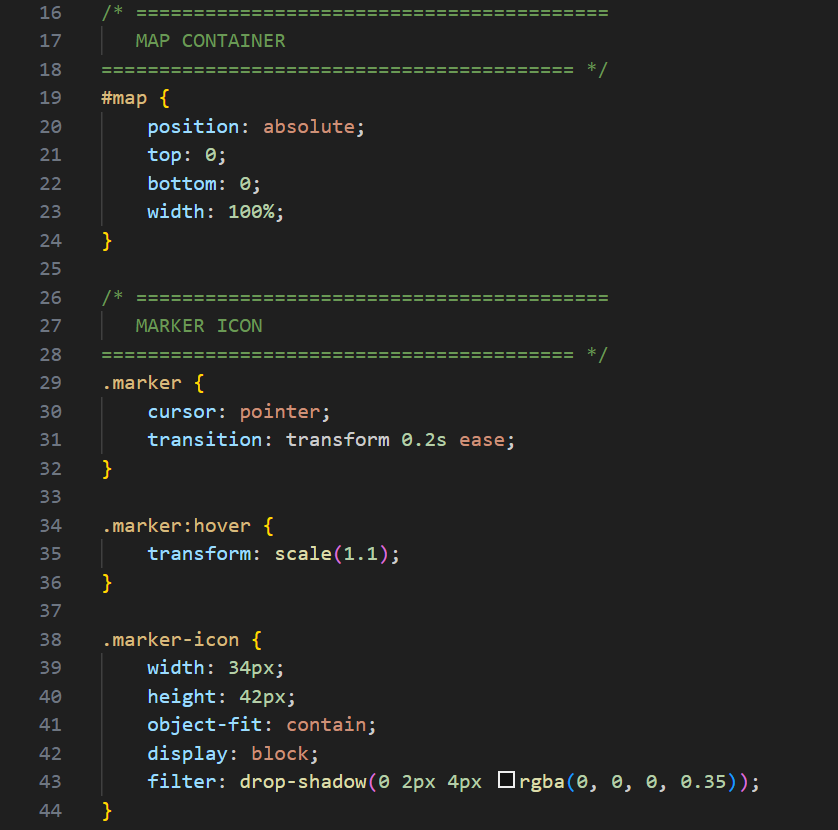
The style.css file handles visual styling including map default extent and placement, marker appearance including hover effects and drop shadows, and responsive design for different screen sizes.
All three parts need each other. Without the HTML, there’s no web canvas. Without the GeoJSON, there are no locations to display. Without CSS, everything looks unpolished. Making sure each was properly linked and loaded was essential to creating a functional, interactive, and professional-looking final product.
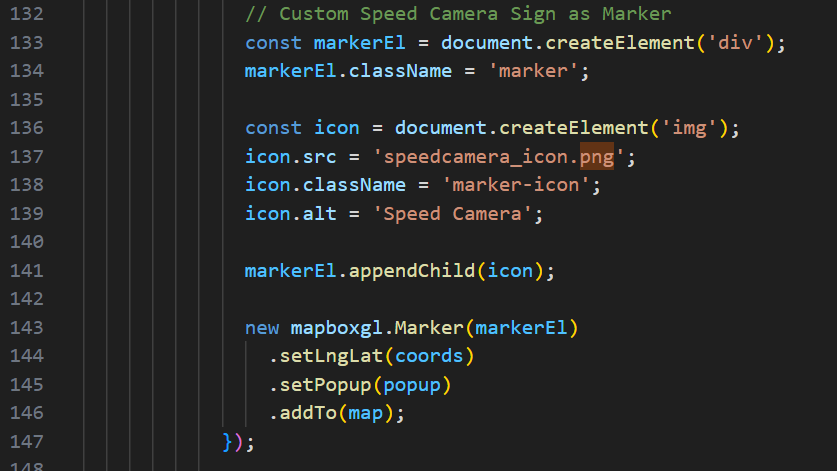
Step 5: Interactive Markers
Using JavaScript, I implemented custom markers with the official speed camera icon:
Step 6: Deployment
I deployed the final map to Netlify’s free hosting service, making it publicly accessible at toronto-speed-camera-locations.netlify.app. Netlify’s continuous deployment means any updates automatically publish.
Technical Challenges and Solutions
Building the interactive map involved several practical technical challenges that shaped the final design. The raw dataset required rigorous cleaning and restructuring as mentioned earlier which lead to a large problem cleaning and thus a few locations could not be obtained.
Additionally, browsers block pages from loading local files for security reasons, meaning the map wouldn’t work when opened directly from the file system; it had to be run through a live server and eventually deployed online to load the GeoJSON data correctly.
The popups also displayed incorrectly at first. Text would overflow outside the popup container, which required removing conflicting styles and adding proper wrapping and layout rules. Although these limitations introduced roadblocks, the final result is a smooth, fully functioning interactive 3D map.
References
¹ CP24. (November 14, 2025). “Speed enforcement camera ban is now in effect in Ontario.” YouTube. https://www.youtube.com/watch?v=zvDqLrSjoos
² The Globe and Mail. (October 2, 2025). “Speed cameras work, but do generate revenue. Is the solution investing more?” https://www.theglobeandmail.com/drive/culture/article-speed-cameras-work-but-do-generate-revenue-is-the-solution-investing/
³ Toronto Metropolitan University & The Hospital for Sick Children. (July 24, 2025). “Automated cameras cut speeding by 45 per cent in Toronto school zones, study finds.” https://www.torontomu.ca/news-events/news/2025/07/cameras-cut-speeding-by-45-per-cent-in-toronto-school-zones/
⁴ CBC News. (November 29, 2022). “Toronto drivers paying $34M in fines thanks to speed cameras.” https://www.cbc.ca/news/canada/toronto/toronto-speed-cameras-millions-in-fines-1.6668443
⁵ CBC News. (November 29, 2022). “Toronto drivers paying $34M in fines thanks to speed cameras.” https://www.cbc.ca/news/canada/toronto/toronto-speed-cameras-millions-in-fines-1.6668443
⁶ CityNews Toronto. (March 13, 2025). “Toronto doubling the number of speed cameras on city streets.” https://toronto.citynews.ca/2025/03/13/toronto-doubling-the-amount-of-speed-cameras-on-city-streets/
⁷ Narcity. (April 15, 2025). “Toronto just got 75 new speed cameras and they’re already active in ‘problematic’ areas.” https://www.narcity.com/toronto/toronto-new-speed-cameras-2025
⁸ Ontario Ministry of Transportation. (September 24, 2025). “Ontario Protecting Taxpayers by Banning Municipal Speed Cameras.” https://news.ontario.ca/en/release/1006534/
⁹ Toronto Metropolitan University. (July 2025). “Study on Automated Speed Enforcement Effectiveness.” (Referenced in multiple sources as demonstrating 87% reduction in vehicles exceeding speed limit by 20+ km/h)
¹⁰ ST Lawyers. (November 14, 2025). “Toronto Layoffs After Speed Camera Ban: Severance Pay for 1,000 Workers.” https://stlawyers.ca/blog-news/toronto-layoffs-speed-camera-ban-severance/
¹¹ City of Toronto. (2025). “Automated Speed Enforcement & Open Data Portal.” https://www.toronto.ca/services-payments/streets-parking-transportation/road-safety/vision-zero/safety-initiatives/automated-speed-enforcement/
¹² Mapbox. (2025). “Add 3D terrain to a map.” Mapbox GL JS Documentation. https://docs.mapbox.com/mapbox-gl-js/example/add-terrain/
¹³ Halliday, L. (April 15, 2019). “Mapbox – Interactive maps in React.” YouTube. https://youtu.be/JJatzkPcmoI?si=HMYAtzRkYQ-nbR4y