SA8905: Geovisualization Project
Erika French
Background
Tornado Alley has no definitive boundary. The NOAA National Severe Storms Laboratory explains that Tornado Alley is a term invented by the media to refer to a broad area of relatively high tornado occurrence in the central United States, and that the boundary of Tornado Alley changes based on the data and variables mapped (NOAA National Severe Storms Laboratory, 2024). This inspired my geovisualization project, in which I wanted to visualize all tornado occurrences in the United States and see how the spatial distribution of tornadoes, or what could be deemed as tornado alley, would change based on different spatial queries.
Data
The data used for this project are all publicly available for download at the links provided below.
The NOAA’s National Weather Service Storm Prediction Center publishes tornado occurrence data dating back to 1950. This file can be found on their website and is named ‘1950-2024_all_tornadoes.csv’. Additionally, a data description file can be viewed here.
The US Boundary layer was downloaded from the US Census Cartographic Boundaries website. The ‘2024 1 : 500,000 (national) States’ shapefile was chosen.
How-To!
Part One: Geoprocessing in ArcGIS Pro
Two important tasks must be completed using ArcGIS Pro.
- Creating point data for all tornado occurrences.
- Creating tornado paths for all applicable tornado occurrences.
Here is how these tasks were completed.
Creating the tornado occurrence point data layer
- Add data to the map.
Open a new ArcGIS Pro Project and add the ‘1950-2024_all_tornadoes.csv’ and the ‘2024 1 : 500,000 (national) States’ shapefile to the current map.
2. Create point data.
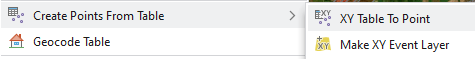
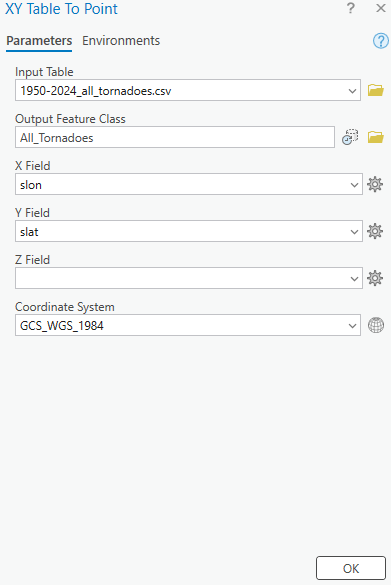
Right click on the ‘1950-2024_all_tornadoes.csv’ in the contents pane and navigate to “XY Table to Point”. Fill out the parameters as pictured below and run. This creates point data for all tornado occurrences using the start longitude and start latitude.
3. Creating a unique Tornado ID Field
Currently, there is no unique tornado ID field as tornado numbers are reused annually. We will now create a unique tornado ID field. Right click on the new All_Tornadoes layer and navigate to Data Design > Fields. Here, add a new field as pictured below.

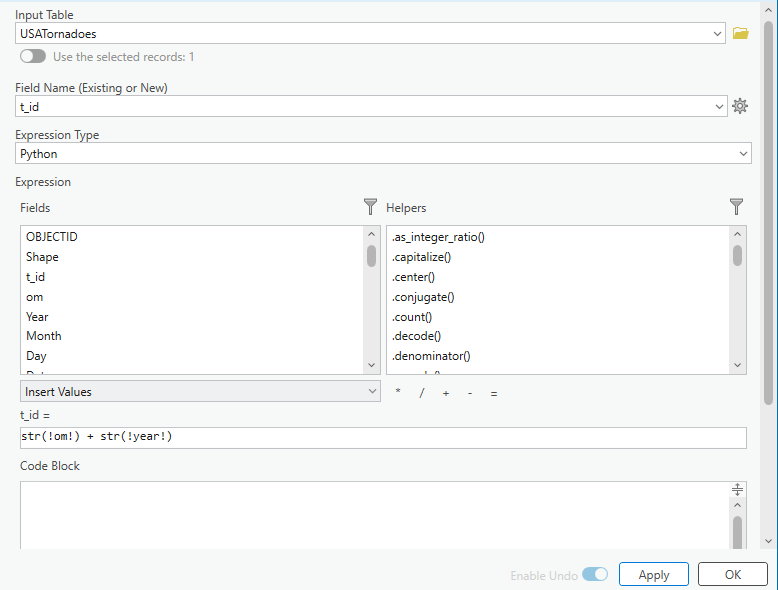
Open the All_Tornadoes attribute table and navigate to the new t_id field. Right click and choose Field Calculate. Here, we will create a unique tornado ID by concatenating the om field and the year field as pictured below.
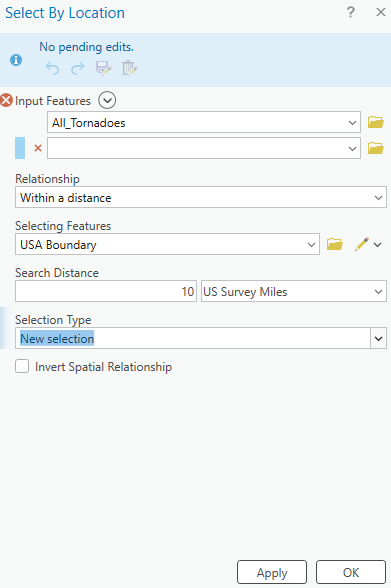
4. Using Select by Location to clip point occurrences apppearing outside the United States.
With the All_Tornadoes layer selected, navigate to Select by Location and fill the parameters out as pictured below.
Right-click on the All_Tornadoes layer and navigate to Data > Export Features. Ensure that you are exporting the selected records. Name this new feature layer “USA_Tornadoes”.
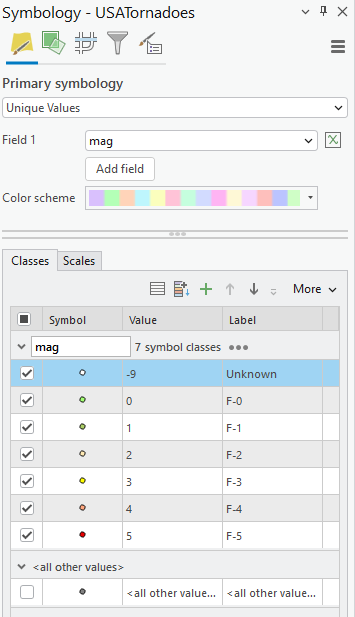
5. Symbolizing Point Occurrences
Navigate to the USA_Tornadoes layer symbology. Here, we will choose unique values and symbolize the Magnitude field (mag) as pictured below.
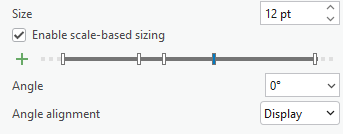
Enable scale-based sizing of points at appropriate ranges so that they do not crowd the map at its full extent. To begin, I used 3 pt, then 8 pt, and then 12 pt progressive sizing.
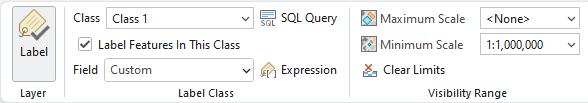
6. Labelling Point Occurrences
Right-click on USA_Tornadoes and navigate to labeling properties. We would like to label each occurrence with its magnitude. This Arcade expression leaves any points with a -9 value unlabelled, as they have unknown magnitudes.
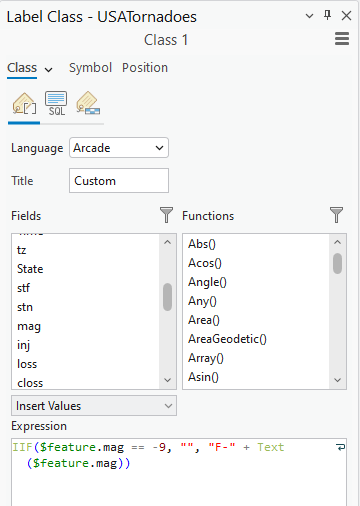
Under the new Label Class, navigate to symbol and fill out the settings as pictured below.
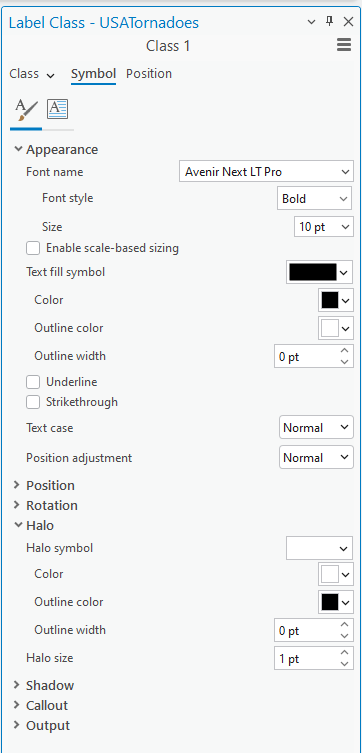
Under Visibility Range, fill out the minimum scale as pictured below. This will stop the labels from crowding the map when zoomed out. Save your project!
Creating tornado paths
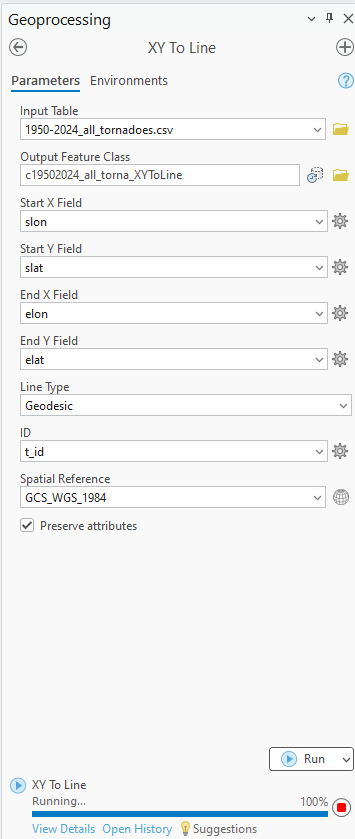
- Use the XY to Line Tool to create paths
Launch the XY to Line tool. Use the ‘1950-2024_all_tornadoes.csv’, as the input feature. Fill out the parameters as pictured below. This will create a line from each tornado’s start lat/long to end lat/long. Running this will take a few minutes, be patient. Name this new layer “Tornado Paths”
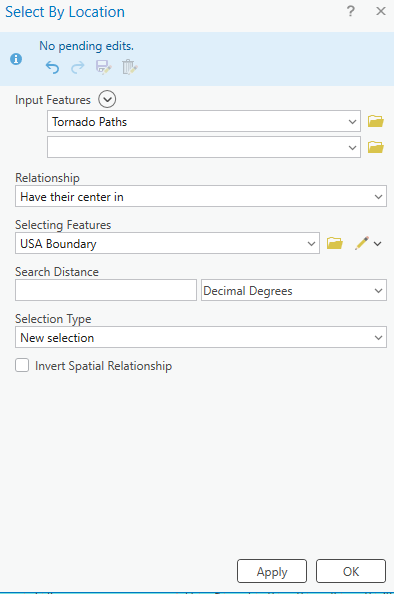
2. Select by Location all tornado paths in USA
Some tornadoes may only have a start lat/long, and no end lat/long recorded. In this case, the end of their path will appear at a 0,0 lat/long. To remove all of these inaccurate paths, we will peform a select by location. Fill out the parameters as pictured below.
Open the tornado paths attribute table and switch the selection. Visually confirm that the only highlighted paths are now outside of the USA. Delete these records.
3. Creating a Buffer
To appropriately visualize the width of the tornado’s path, we will create a buffer of the Tornado Paths layer. Start by adding a new field to the Tornado Paths layer as pictured below.

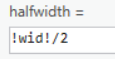
Open the attribute table and field calculate the new halfwidth field as pictured below.
Now we can create a buffer. Open the buffer tool and fill in the parameters like below.
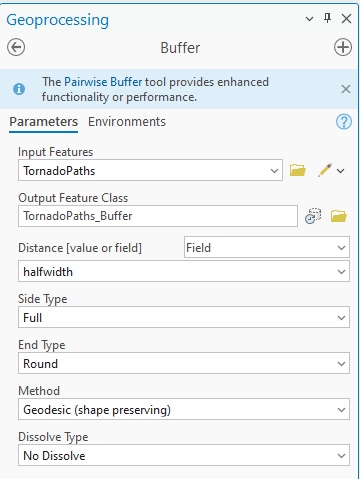
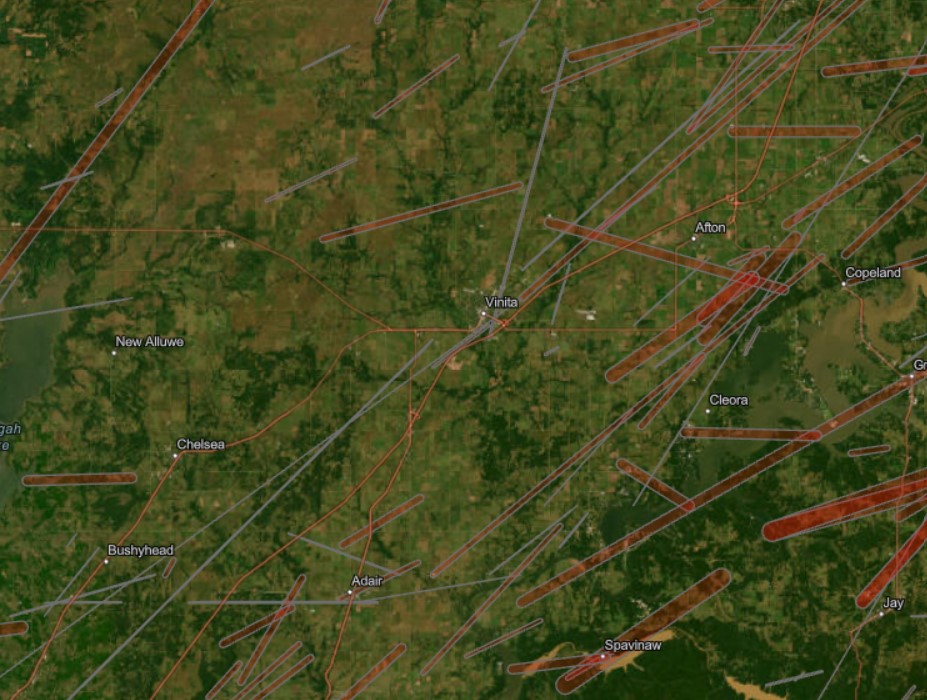
Symbolize this buffer in red and change the transparency to 60%. Add a 1 pt outline of grey. We have now created a layer showing the path of each tornado visualizing accurate length and width.
Save the project. Navigate to the share toolbar and share as a web map. We can now open our web map in ArcGIS Online.
Part Two: Preparing the Web Map for Experience Builder
- Open the web map.
Open up the new web map in ArcGIS Online. The web map should have two layers: USA Tornadoes and Tornado Paths. Any other layers can be removed. Our map appears the same way in which we saved it in ArcGIS Pro.
2. Format Popups.
Click on the USA Tornadoes layer. On the right hand pane, navigate to popups. Here, we will create some attribute expressions using Arcade to create nicely formatted fields for our popups. Add the following attribute expressions:
Length:
Text($feature.Len, “#,###.##”) + ” miles”
Width:
Text($feature.wid, “#,###.##”) + ” yards”
Crop Loss:
IIf($feature.closs_1 == 0,
“Unknown”,
“$” + Text($feature.closs_1, “#,###”) + ” million”
)
Property Loss:
IIf($feature.Year < 1996,
When(
$feature.closs == 0, “Unknown”,
$feature.closs == 1, “$50 – $500”,
$feature.closs == 2, “$500 – $5,000”,
$feature.closs == 3, “$5,000 – $50,000”,
$feature.closs == 4, “$50,000 – $500,000”,
$feature.closs == 5, “$500,000 – $5,000,000”,
$feature.closs == 6, “$5,000,000 – $50,000,000”,
$feature.closs == 7, “$50,000,000 – $500,000,000”,
$feature.closs == 8, “$500,000,000 – $5,000,000,000”,
$feature.closs == 9, “$5,000,000,000+”,
“No data”
),
“$” + Text($feature.closs, “#,###”))
Number of Fatalities:
Text(Round($feature.loss, 0), “#,###”)
Magnitude:
IIf($feature.mag == -9,
“Unknown”,
“F-” + Text($feature.mag)
)
State:
var abbr = Upper($feature.State);
var full = When(
abbr == “AL”, “Alabama”,
abbr == “AK”, “Alaska”,
abbr == “AZ”, “Arizona”,
abbr == “AR”, “Arkansas”,
abbr == “CA”, “California”,
abbr == “CO”, “Colorado”,
abbr == “CT”, “Connecticut”,
abbr == “DE”, “Delaware”,
abbr == “FL”, “Florida”,
abbr == “GA”, “Georgia”,
abbr == “HI”, “Hawaii”,
abbr == “ID”, “Idaho”,
abbr == “IL”, “Illinois”,
abbr == “IN”, “Indiana”,
abbr == “IA”, “Iowa”,
abbr == “KS”, “Kansas”,
abbr == “KY”, “Kentucky”,
abbr == “LA”, “Louisiana”,
abbr == “ME”, “Maine”,
abbr == “MD”, “Maryland”,
abbr == “MA”, “Massachusetts”,
abbr == “MI”, “Michigan”,
abbr == “MN”, “Minnesota”,
abbr == “MS”, “Mississippi”,
abbr == “MO”, “Missouri”,
abbr == “MT”, “Montana”,
abbr == “NE”, “Nebraska”,
abbr == “NV”, “Nevada”,
abbr == “NH”, “New Hampshire”,
abbr == “NJ”, “New Jersey”,
abbr == “NM”, “New Mexico”,
abbr == “NY”, “New York”,
abbr == “NC”, “North Carolina”,
abbr == “ND”, “North Dakota”,
abbr == “OH”, “Ohio”,
abbr == “OK”, “Oklahoma”,
abbr == “OR”, “Oregon”,
abbr == “PA”, “Pennsylvania”,
abbr == “RI”, “Rhode Island”,
abbr == “SC”, “South Carolina”,
abbr == “SD”, “South Dakota”,
abbr == “TN”, “Tennessee”,
abbr == “TX”, “Texas”,
abbr == “UT”, “Utah”,
abbr == “VT”, “Vermont”,
abbr == “VA”, “Virginia”,
abbr == “WA”, “Washington”,
abbr == “WV”, “West Virginia”,
abbr == “WI”, “Wisconsin”,
abbr == “WY”, “Wyoming”,
abbr
);
return full;
In the popups options, choose the fields pictured below to appear in the popups. Ensure you are using the attribute expressions you have made so that the popups have the data formatted as desired.
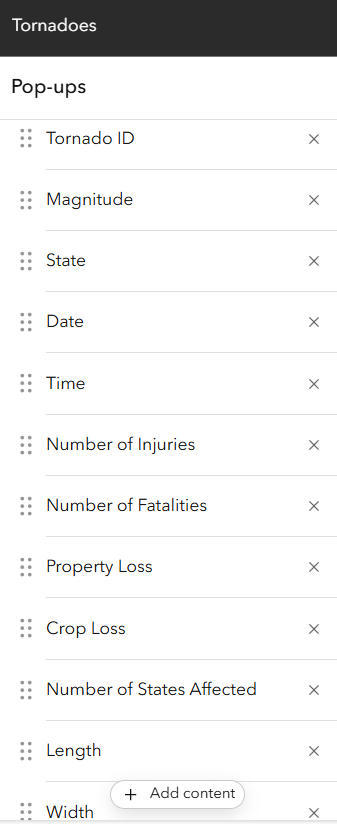
Repeat these steps on the Tornado Paths layer. Save the web map.
Part Three: Creating the Experience
- Choose a template.
In ArcGIS Online, select create a new app > Experience Builder. This experience was generated using the template. However, I published the template with all of the edits made to create the Historical Tornado Events in the United States Experience.
2. Connect your web map.
Connect your Tornadoes web map to the map widget. Modify a custom extent for the map to appear at.
3. Configure filter widgets.
For each filter widget, configure a SQL expression using predefined unique values. For example, configure the Magnitude filter as pictured below.
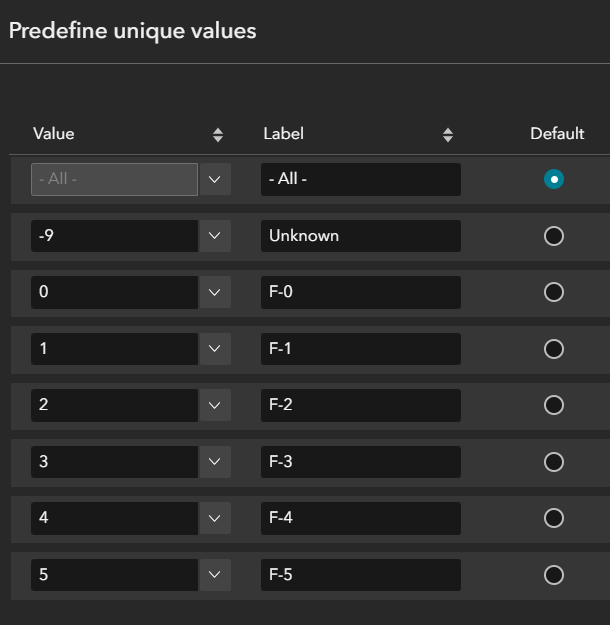
This allows the user to select a value from a dropdown rather than typing in a value.
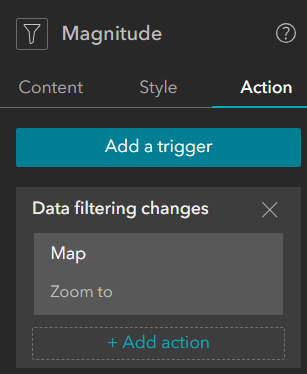
Additionally, configure a trigger action that will action the map to zoom to the filtered records, as pictured below.
4. Configure Feature Info widget.
Connect the feature info widget to the map widget. This widget will show the same information that we formatted in the web map popups.
5. Configure the Select Features widget.
Connect the Select Features widget to the map widget. Enable select by rectangle and select by point.
6. Save and publish! All widgets have now been configured.
Result
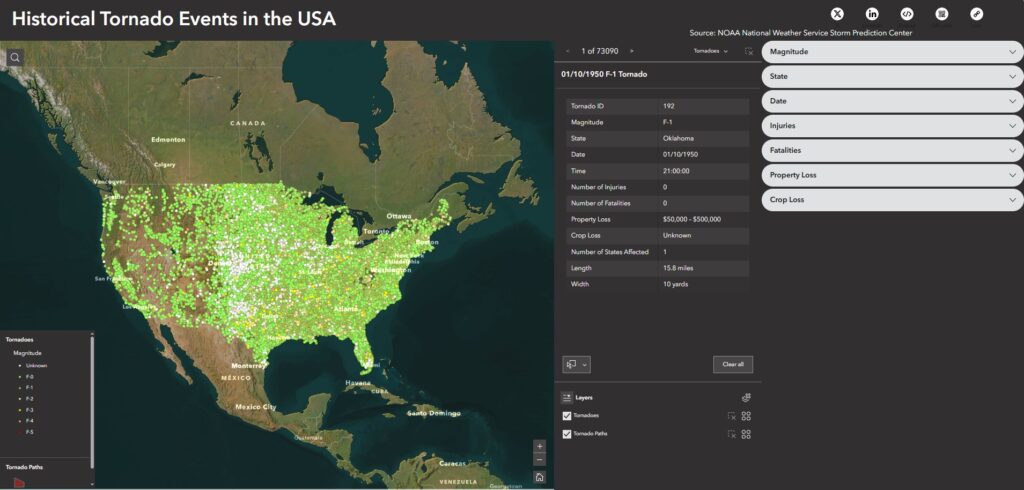
The Experience Builder output is an interactive web app that allows users to explore historical tornado occurrences dating back to 1950, their paths of destruction overlaying aerial imagery to see the exact structures and cities they passed through, and compares the statistics of human and financial loss caused by each. Users can see where the most severe tornadoes tend to occur, or visualize severity temporally.
Sources
The Online Tornado FAQ (by Roger Edwards, SPC)