Anastasiia Smirnova
SA8905 Geovis project, Fall 2022
Introduction
Through this project I wanted to gain and advance my skills in both storytelling and visualizing spatial data. Here you can learn more about my attempt of using ArcGIS StoryMaps to highlight the importance of including children in the urban planning agenda and to show the World- and Canada-wide spatial patterns of urban areas’ commitment to creating inclusive urban environments with children in mind.
I did it by mapping municipalities that are participating in UNICEF’s Child Friendly Cities Initiatives (CFCI), which aim to promote cities where the “ voices, needs, priorities and rights of children are an integral part of public policies, programs and decisions.”
Technology
I used ESRI’s ArcGIS Pro, Online Map Viewer and StoryMaps for my project. First, I used the desktop app (ArcGIS Pro) to import my data and create my initial maps. After that I uploaded the layers that I wanted to use as web layers to my ArcGIS account, and then I finalized them using ArcGIS online applications. I used the online map viewer to adjust symbology as necessary as was trying to figure out what worked better for each part of my story. It was easy to go back and forth between the Map Viewer and StoryMaps – to make the necessary changes, then to see how the updated maps work with the story, and then repeat these steps as needed. The Map viewer generally had the functionality I needed to change my map symbology and I did not have to go back to ArcGIS Pro too often to make modifications after I uploaded my layers online.
I liked the functionality of StoryMaps. I used the sidecar option to introduce my story, and for showing most of my maps. I find that this block type provides some of the most immersive experience while scrolling, so I used it for the parts of the story that I wanted to keep the reader’s attention on.
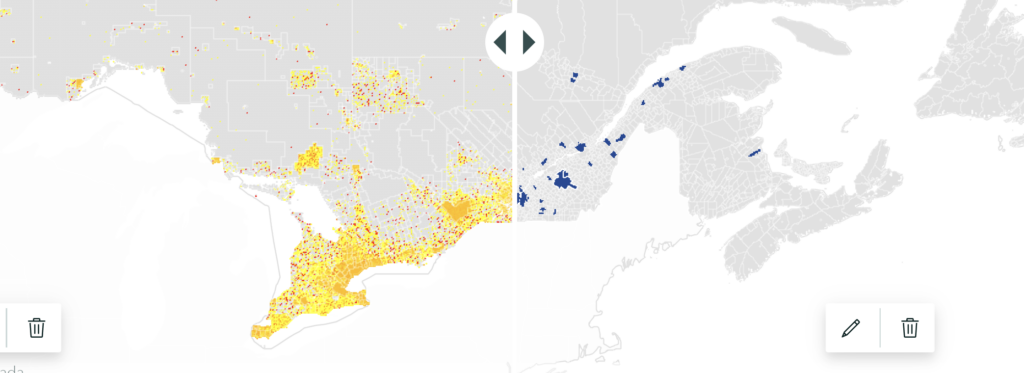
I found that the swipe option worked well for showing comparisons. In a regular map, it is often difficult to show all information you want without cluttering the map with too many layers and making the map unreadable. The swipe option can help solve this problem. As such, I used this function to show how many children did (not) live within the municipalities that were part of CFCI and therefore could (not) benefit from the initiative.
For inserting your maps to any blocks of StoryMaps, you can choose to either use your maps uploaded as images or insert the actual interactive online maps. While the image option has some benefits, such as more flexibility in styling the map and faster loading, the main benefit of inserting the actual online maps is interactivity. You can zoom in and out, search for a specific location, show/hide legend, learn more about each unit on the map and so on (as the creator of the story, you can edit and set restrictions of what readers can and cannot do with your online maps).
Since I wanted to keep my maps as simple visually as possible, I went with the second option. This way, if the reader wanted to learn more about my maps and the information they displayed, they could do so by using the interactive map functions.
Interesting findings
In addition to the main message of the project (the need to promote child friendly cities), the maps showed how the choice of data, scale and mapping methodology can influence the results and representation. On the CFCI website, the main map was showing all countries that were involved in the CFCI. The map did not consider how many municipalities in each country were actually involved in the initiatives.
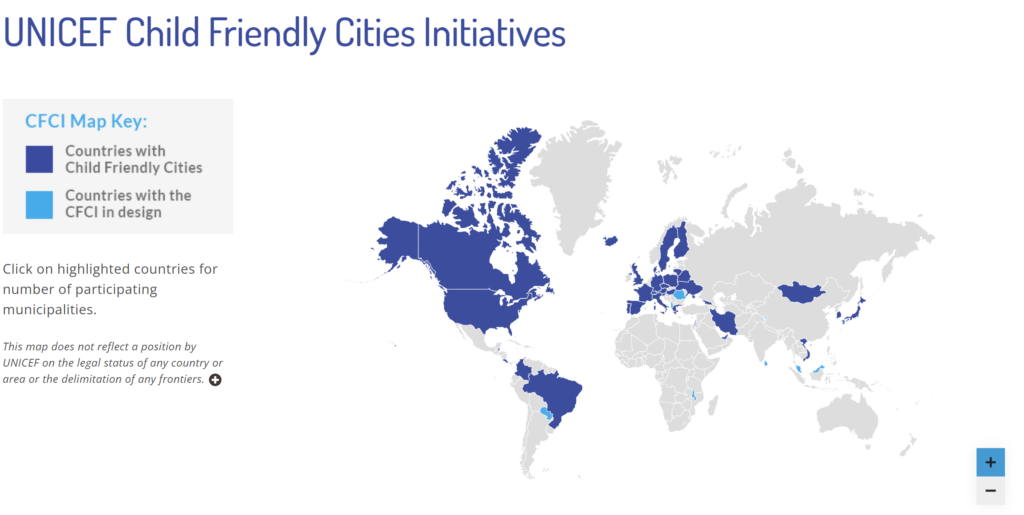
This way of displaying data may be misleading, since the level involvement of each country varied greatly. In some countries, most of the territory was part of CFCI, but some other countries only had a couple municipalities each with UNICEF’s child friendly initiatives.
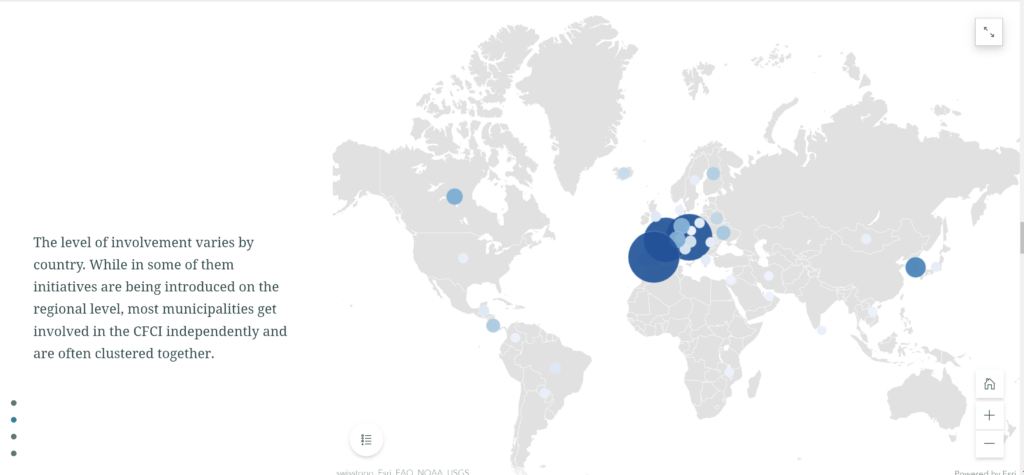
For this story, in addition to the world CFCI country map similar to the one from the website, a proportional symbol map was created to show how many municipalities from each country were actually involved in the CFCI and I put these two maps in one sidecar block so that the reader could swipe back and forth to see how the distribution of CFCI changed with the change of the variable, and what the actual level of involvement if each country was.
When zoomed in, even more information about the unevenness and clustering in the spatial distribution of the CFCI municipalities can be discovered.
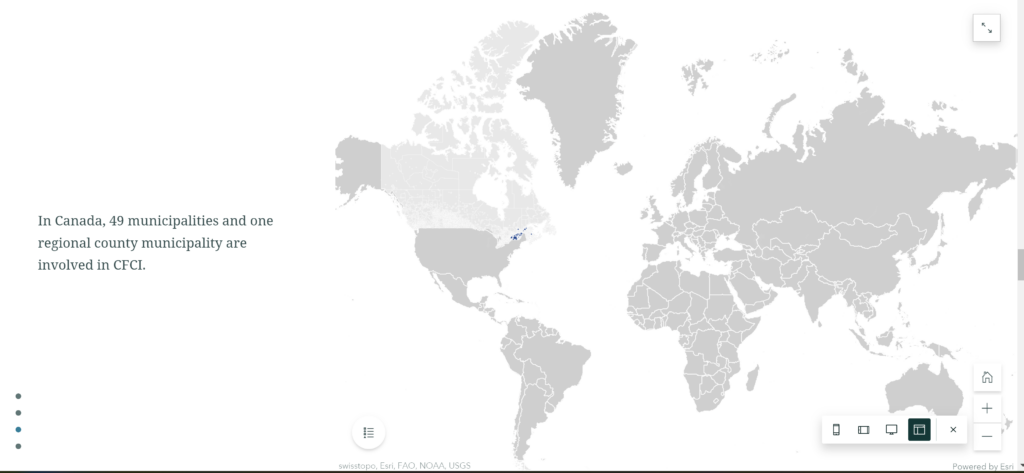
The sidecar block (I used the float side by side option for my maps), and the smooth transitions it provided, worked well for showing the differences between the maps, as well as for zooming in into a smaller scale map.
Challenges
Some of the main challenges for me were associated with updating the maps if I wanted to change something. It took some time for me to figure out what could be done at which step of the process (with different apps) and how far back I had to go to modify something. As such I had trouble updating and modifying the legends for the maps.
Unfortunately, the options for adjusting the legends using the ArcStory editor or the online map viewer were limited. For instance, it was impossible to hide or edit the name of the column which contained data used in the map while using the online apps. Since I was creating my original layers in ArcGIS Pro, then uploading them as web layers, and then adjusting my maps further in the online map viewer, it was difficult to go back to change the original data in the end, just to modify one little line on the map legend. Only some parts of the legend could be modified using the online apps. So, one of the lessons I took from this experience is that you need to make sure all the column names are appropriate before making all the edits online if you are using a similar process as I did. It is also helpful to think about the legends right from the start.
Conclusion and results
In general, I am satisfied with the ArcGIS StoryMap platform. It was easy to use, and it did a good job of assisting me in creating a map-based story that looks clean and flows smoothly. I am planning on further exploring the StoryMap functionality in the future.
If you are interested in learning more about child friendly cities and seeing my StoryMap result, you can follow this link:
Canadian cities and towns for happy children (arcgis.com): Mapping Child Friendly City Initiatives in Canada and in the World using ArcGIS StoryMaps