By: Anderson Webber
Background
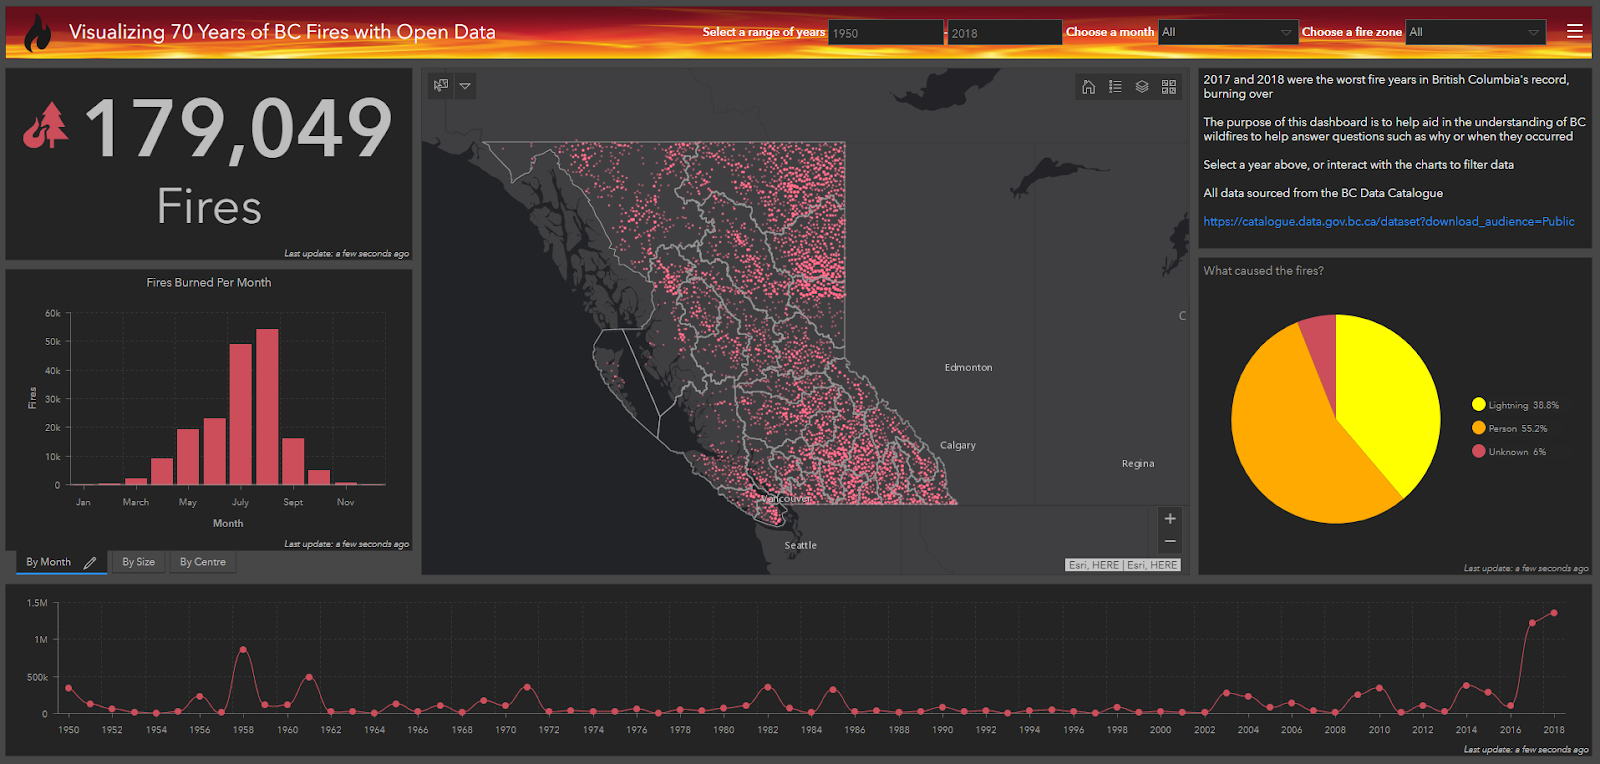
2017 and 2018 were the two worst fire years in the BC’s known history, diminishing provincial air quality and destroying healthy ecosystems beyond natural levels. These consecutive record-breaking years have led to many discussions regarding the causes of such fires, with the hope to better understand why these events occurred and hopefully prevent such events from reoccurring. The purpose of this project is to help aid in the understanding of BC wildfires through an interactive summary of the 179,000 wildfires occurring within the province over the last 68 years via an Operations Dashboard.
Data and Technology
Dashboards have become a very trendy tool for geovisualizations, designed to display location aware visualizations and analytics packaged in an easy to use web or mobile app. ESRI largely markets Operational Dashboards for real-time analytics which aid in such tasks as emergency response, but in this example I will be looking at the dashboard’s utility in understanding a large historical data set; past BC wildfires. BC wildfire data was sourced from the BC open data catalogue containing point locations and attribute data of any fire incident updated on April 1st 2019 with all previous years data since 1950. The following tutorial will allow anybody with an ArcGIS license to replicate this project.
Step 1. Getting the data
Data was downloaded from here:
https://catalogue.data.gov.bc.ca/dataset/fire-incident-locations-historical
Step 2. Data Cleaning
Beyond the date of report and location, the wildfire CSV contained information for each fire including its size, cause and which zone it occurred in… In order to create the widgets I wanted, the data had to be cleaned a bit. To determine which months the fires were worst for example, the date field in the format YYYYMMDD had to be split into three separate fields; Year, Month and Day. This could be done in any data manipulation software such as SQL server, alterex or excel. The simple query needed to select included:
=LEFT(D2,4) to select year
=MID(D2,5,2) to select month
=RIGHT(D2,2) to select days
Step 3. Hosting layer file online
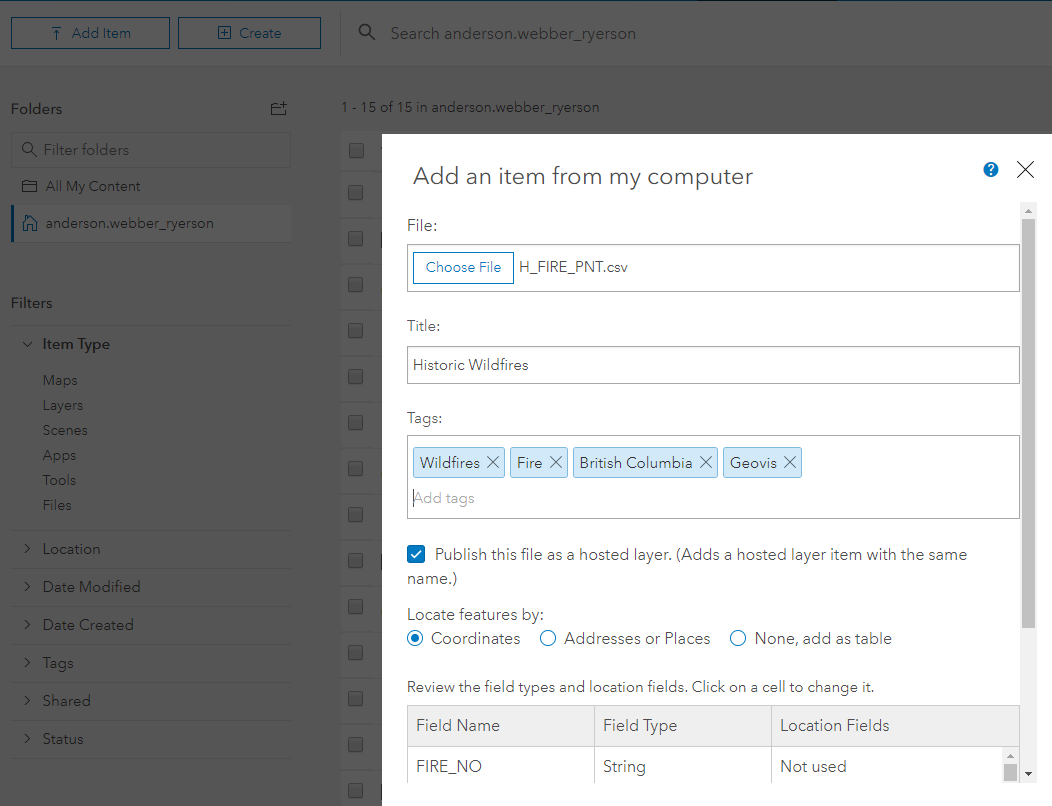
Once data was split it had to be uploaded into ArcGIS online as a hosted layer file in order to be brought into the dashboard webapp. Hosted layers allow for the uploading of large files which can be used in web, desktop or mobile apps. In order to post hosted features you must be part of an ArcGIS organization, and have privileges to post hosted layers. When you add a layer through ArcGIS Online, this is what your options should look like to host a layer:
Step 4. Making a web map
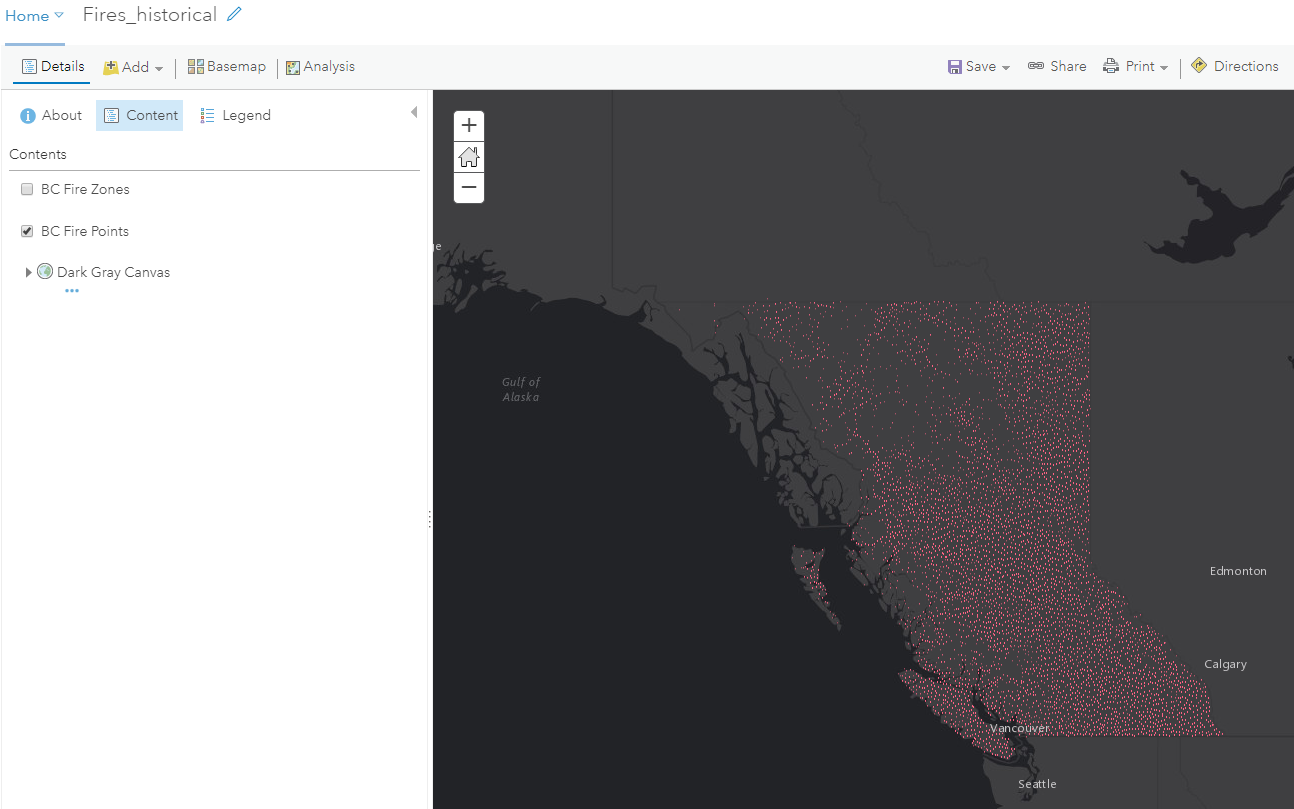
Before creating the dashboard itself, the user must create a web map first. This is done by clicking the “Create” tab then clicking the “Map” button. Once the map is open simply click the “Add +” button and bring in the hosted feature classes we just created. Now you have made a web map with the fire data. Edit symbology and add any other layers you would like in this step. I chose a dark basemap and red ‘firefly’ symbology.
Step 5. Adding fields
Depending on what you want your dashboard to display, more data cleaning and manipulating could be done at this step. As I wanted to see what the different sizes of fires were within BC, I created an ESRI Arcade expression which would calculate a field with ranges. To do this I created a new field with data type ‘Text’ in the Fires table called ‘Sizes’ and calculated the field with:
iif($feature[“SIZE_HA”] <=0.25 , “<0.25”,
iif($feature[“SIZE_HA”] <=10, “0.25-10”,
iif($feature[“SIZE_HA”] <=100, “10-100”,
iif($feature[“SIZE_HA”] <=1000, “100-1,000”,
iif($feature[“SIZE_HA”] <=10000, “1,000-10,000”,
iif($feature[“SIZE_HA”] <=50000, “10,000-50,000”,
iif($feature[“SIZE_HA”] >50000, “>50,000”, 0)))))))
Step 6. Creating the dashboard
Now we are ready to make the dashboard! On the same webmap which was just made, click the Share button -> Create new Webapp -> Operations Dashboard. You can call it whatever you like. Now you have a dashboard shell.
Step 7. Add widgets
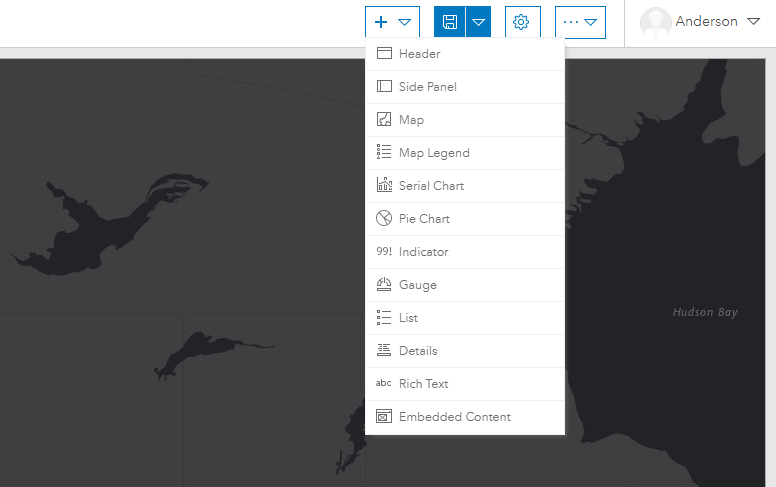
Now comes the fun part. Click the “+” dropdown on the top left of the dashboard and add whatever widgets you want. Widgets can be dragged, resized and stacked allowing for a high level of customization.
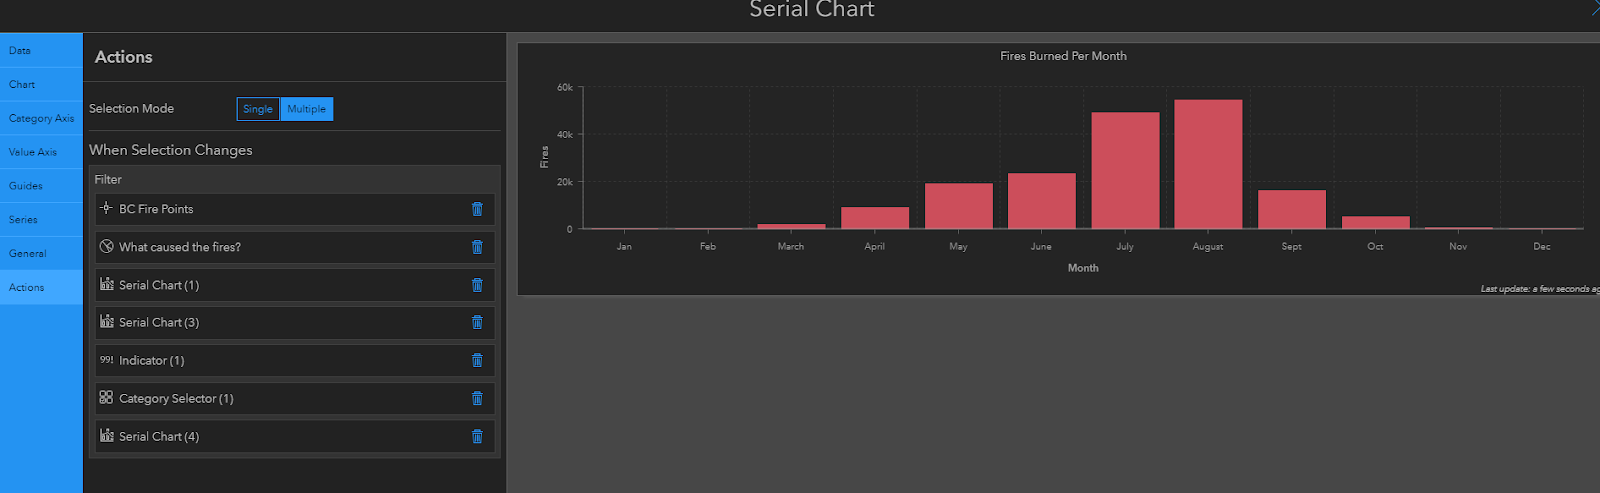
Step 8. Making charts interactive
To make charts interactive, within the widget configured in the ‘actions’ toolbar and add whatever action you like. This means that selecting a bar on the chart below will change the points, indicators and all accompanying data visualizations to the months chosen. The same methods can be applied to any other aspect, including the map itself.
Keep playing around with the widgets. You can also add images. The final product http://arcg.is/1WDSyy. A screenshot can be seen below:
Limitations
Limitations for this project regarded both the data and software itself. For starters, in order to create an Operations Dashboard, you need an authorized ArcGIS account which is not free and therefore accessible to everyone. Another major limitation has to do with the size of the data set. With almost 180,000 fire points, the rending of these points online can encounter problems such as lag and may even may crash if you have limited ram. The third limitation regards the projection. ArcGIS Online defaults to a global WGS 1983 projection, which is not optimal for looking presenting data at the provincial level. Finally, the user’s screen size also has a major impact on the experience of the user. Although it can be opened on mobile devices and tablets, the dashboard becomes more limited, as graphics and titles are cut off or crushed together, taking away from the visual appeal and usability of the dashboards.