by Arsh Grewal
Geovis Class Project @RyersonGeo, SA8905, Fall 2017
The original idea for this project came from a map that Torontonians see all the time. The subway map uses lights to convey information, I wanted to use the same concept and apply it for this project. I decided to use this technique on cities.

By displaying the cities as LED’s, I can use light to display information. To do this I used Python with Raspberry Pi. Raspberry Pi is unique because it has GPIO pins which can be controlled via code. Raspberry Pi works like a low spec computer but it is much more flexible. Python can be used with Raspberry Pi to control current flowing out of the GPIO pins. I decided to use this current to power LED’s.

The image below shows the schematic of how the project would have originally worked. The theme of the project is sustainability in cities. Each entry for the legend is associated with the top 3 cities for that category. Each colour would correspond with a ranking. Green would equal one, Blue equals 2 and Red equals 3. I initially wanted to use Red, Blue and Green to differentiate the ranks. For example, The cities with the highest Livability are Vancouver, Toronto and Calgary in that order. When the LED for Livability (represented with an I) turns on, the LED for Vancouver would turn green, the LED for Toronto would turn blue and the LED for Calgary would turn Red. This would happen for each category. The LED’s would stay on for 4 seconds for each category. The positive end of the LED would connect to a GPIO pin, while the negative end connects to a Ground pin.

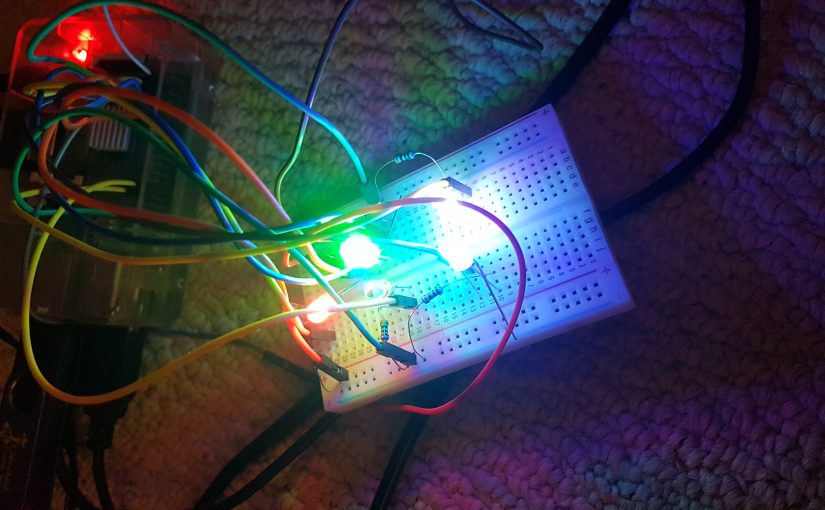
There was a cartographic issue with this idea. The use of red indicates the lowest value, which is not what it means in my case. Red is the third best value (not the worst) and should be represented with the appropriate colour. The issue was that I was unable to find something similar to RGB LED’s, which displayed multiple colours. I could combine the RGB values to create new colours, but the pi can only supply a limited amount of current (~50 mha). Using RGB LED’s to create new colours requires a lot of current. Each LED takes about 20 mha. I could limit the energy consumption by using resistors (I did eventually end up using them) but that would reduce the brightness of the LED’s. I would not have been able to do this with the number of LED’s I planned on using. Instead, I decided to use brightness. I realized I could use (Pulse Width Modulation) PWM to control the brightness of the bulbs. Below is the video of me testing the RGB LED’s.
PWM essentially turns the LED’s on and off at a rapid rate to control brightness (faster than the eye can detect). The longer a bulb is on, the brighter it seems. The video below is me testing the PWM function on the Raspberry Pi.
After deciding to include PWM, I had to change the code I created. Below is the code I used to program the Raspberry Pi.
import RPi.GPIO as GPIO #Imports GPIO functions in the library
import time
GPIO.setmode(GPIO.BCM)
GPIO.setwarnings(False)
GPIO.setup(18,GPIO.OUT) #Sets pin 18 as active
v=GPIO.PWM(18,100) #Sets pin 18 to 100hz frequency for PWM, aliased to ‘v’
v.start(100) #Pin 18 is on for a 100% of the time
print “Vancouver on” #Displays ‘Vancouver on’ on the command screen
GPIO.setup(23,GPIO.OUT)
print “Toronto on”
t=GPIO.PWM(23,100)
t.start(10) #Pin 23 is on for 10% of the time.
GPIO.setup(4,GPIO.OUT)
print “Calgary on”
c=GPIO.PWM(4,100)
c.start(1) #Pin 4 is on for 1% of the time
GPIO.setup(12,GPIO.OUT)
print “Indicator 1 on”
GPIO.output(12,GPIO.HIGH) # Turns on Pin 12 (Maximum brightness)
time.sleep(4) #Pauses code for 4 seconds
print “Vancouver off”
v.stop() #Stops PWM for pin 18
print “Toronto off”
t.stop()
print “Calgary off”
c.stop()
print “Indicator 1 off”
GPIO.output(12,GPIO.LOW) #Turns off pin 12
#A similar code would be run for the next category.
After the coding was complete I tested the connections using the Breadboard, which allows the user to test connections without soldering. After a few trials, the code worked! The next step was to connect the cables with the LED’s via soldering. Soldering is used to make connections more permanent. A solder is a combination of highly conductive metals. The solder is heated until it melts, and the liquid metal is then applied to the ‘connection’. The liquid solder then cools and hardens. I soldered the resistors to the positive end of the LED and then soldered the copper wires to each end of the LED.
After all the LED’s were soldered, the next step was to build the actual physical model. A map of Canada with the appropriate cities was glued onto a piece of cardboard. Holes were made for the required cities, after which the LED’s were installed. I used Styrofoam from old boxes to make the base for the project. After about 8 hours of building the model, I was ready to test the final product.
The LED map finally worked! I ran into one problem. I did not have a monitor as a display for the Raspberry Pi. I was using my TV as the display, but I could not bring that with me to campus. Instead I downloaded PuTTy. PuTTy allowed me to connect my laptop to the command module of the pi using an ethernet cable. All I had to do was type ‘sudo python LED.py’ in the command module to make it work. I made it so the project would work with a simple right click of the mouse. The image below shows some of the wiring required to make the map work.
