Geovis Project Assignment, TMU Geography, SA8905, Fall 2025
Hello everyone! I am excited to share my running geovisualization blog with you all. This blog will allow you to transform the way you use GPS data from your phone or smart watch!
This idea came to me as I recorded my half marathon run on my apple watch in 2023 in the app “Strava”. Since then, I developed an interest in health tracking data and when assigned this project, I thought, hmm maybe I can make this data my own.
As a result, I explored the options and was able to create a 3D representation of my run and how I was doing physically throughout.
Here is a Youtube link to the final product!
The steps are as followed if you want to give this type of geospatial analysis a try yourself!
Step 1.
You will need to have installed the app Strava. This health and fitness app will track your GPS data from either your phone or watch and track your speed, elevation and heartrate (watch only). Apart from this, you will also need the app RunGap. This app will allow you to transfer your activity data and export it to a “.fit” file. A .fit file is a special data source that can track heartrate, speed and elevation that is geolocated by x and y coordinates every second (each row).
Step 2.
Once you have the apps downloaded, start a health activity on the Strava app. From there you can transfer your Strava data to RunGap.
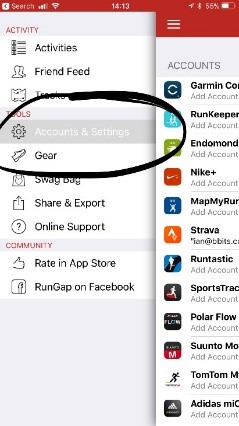
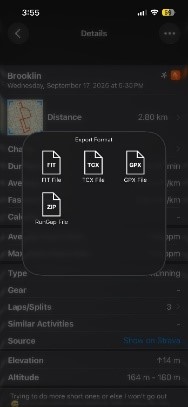
After you sign in and import the Strava data, go to the activity you want to export as a .fit file. Save the .fit file and transfer it to your computer.
Step 3.
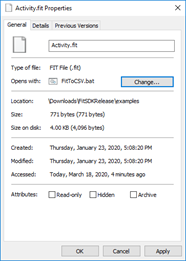
Now that you have the .fit file, you will need to download a tool to convert it to a CSV. This can be found at https://developer.garmin.com/fit/overview/. In Step 1 of this page you will need to download the https://developer.garmin.com/fit/download/ Fit SDK. The file will be in your downloaded folder under FitSDKRelease_21.171.00.zip. You will need to unzip this file and navigate to >java>FitToCSV.bat. This is the tool that you will use on the .fit file. To do this, go to your .fit file properties and change the “Open with:” application to your >java>FitToCSV.bat path.
Now simply run the .fit file and the tool will open and covert it to a CSV in the same folder after pressing any key to continue…
Step 4.
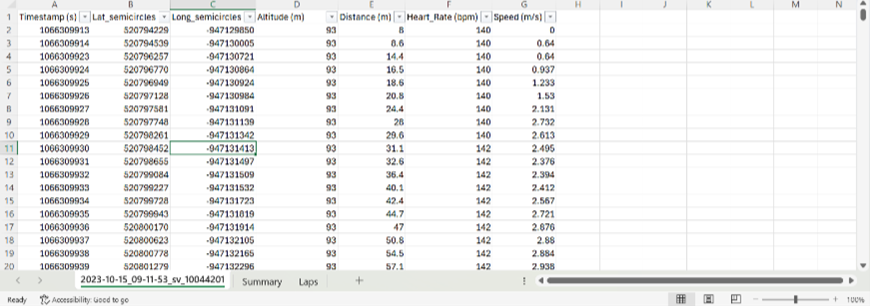
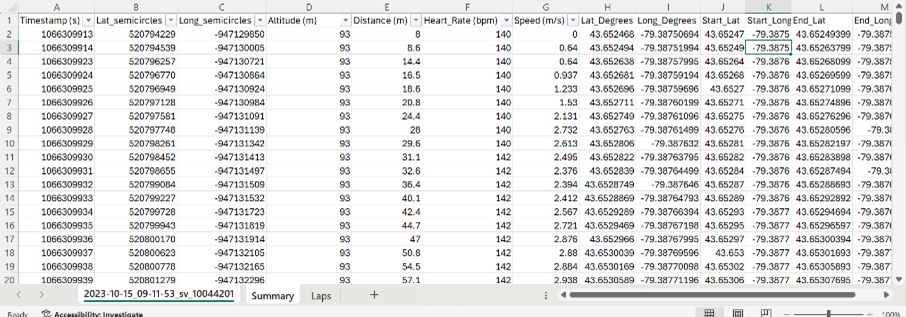
Now, open your CSV. The data is initially messy, and the fields are mixed. To clean it I added a new sheet, and then deleted from the original, continuing to narrow it down using the filter function. In the end, you only want the “data” rows in the Type column and rows with lat and long coordinates to create a point feature class. I also renamed the fields. For example, value 1 became Timestamp(s), which is used as the primary key to differentiate the rows. To get the coordinates in degrees, I used this calculation:
- Lat_Degrees: Lat_semicircles / 11930464.71
- Long_Degrees: Long_semicircles / 11930464.71
Furthermore, to display the points as lines in the final map, 4 more fields are needed to be added to the excel sheet. This is the start lat, start long, end lat and end long fields. These can simply be calculated by taking the coordinates of the next row for the end lat and end long. You will also need to do this with altitude to make a 3D representation of the elevation.
Step 5.
Now that your CSV is cleaned, it is ready to be exported as spatial data. Open ArcGIS Pro and create a new project. From here, load your CSV into a new map. This table will be used in the XY to line geoprocessing tool using the start and end coordinates for the WGS_1984_UTM_Zone_17N projection in Toronto.
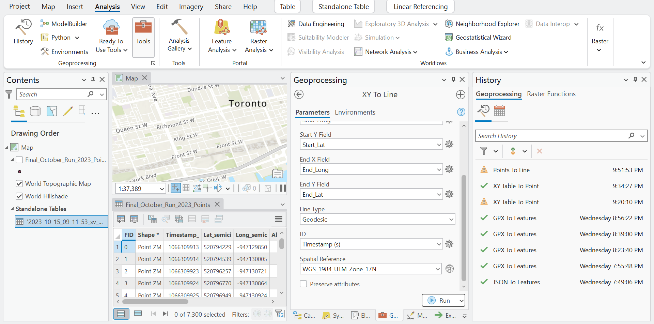
Once you run the tool, your data should look something like this, displaying lines connecting each initial point/row.
Step 6.
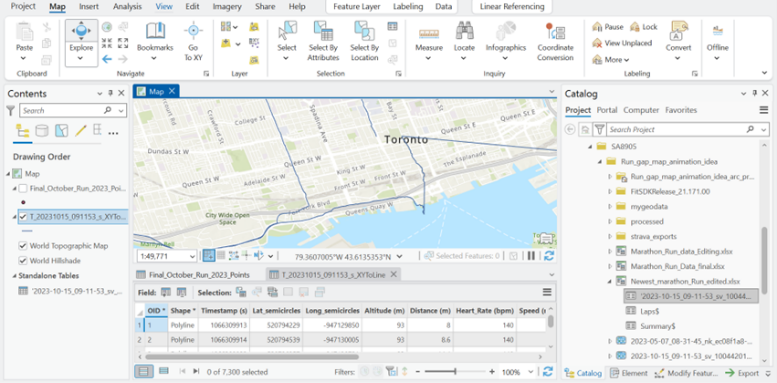
Now it is time to bring your route to life! Start by running the Feature To 3D By Attribute geoprocessing tool on your feature class using the height field as your elevation/altitude.
Your line should now be 3D when opening a 3D Map Scene and importing the 3D layer
Step 7.
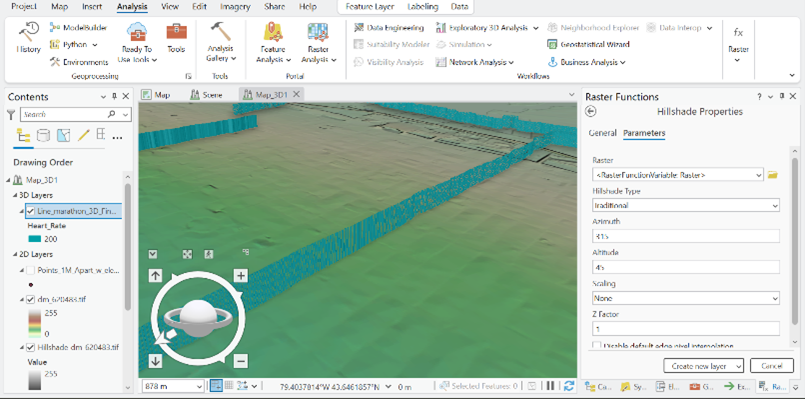
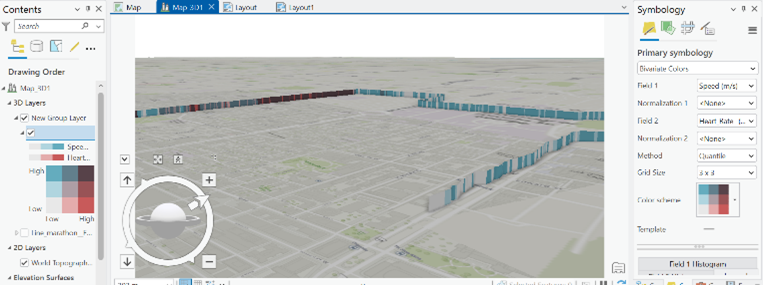
To add more dimensions to the symbology colours, I used “Bivariate Colours”. This provides a unique combination of speed and heart rate at each leg of the race.
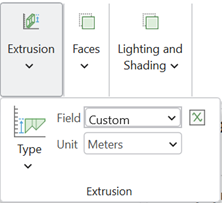
To make the elevation more visually appealing, I used the extrusion function on the line feature class. Then, I used the “Min Height” category with the expression “$feature.Altitude__m_ / 3”. To further add realism, I added the ground elevation surfaces layer called WorldElevation3D/Terrain3D, so that the surrounding topography pops out more.
Step 8.
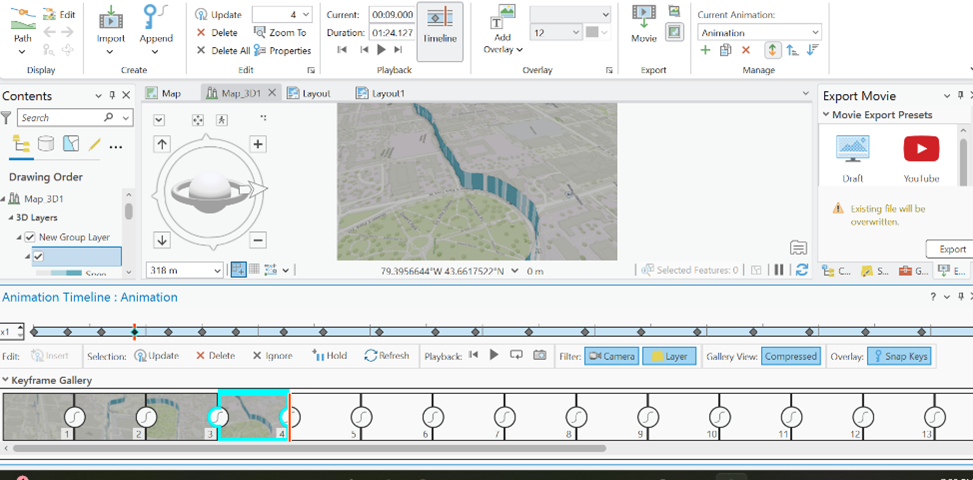
Now that the layer and symbology are refined, the final part of the visualization is creating a Birdseye view of the race trail from start to finish. To do this, I once again used ArcGIS Pro and added an animation in the view tab. From here I continuously added key frames throughout the path until the end. Finally, I directly exported the video to my computer.
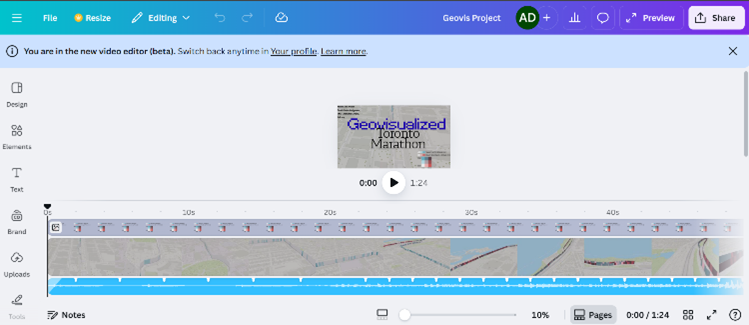
Step 9. Canva
To conclude, I used Canva to add the legend to the map, add music, and a nice-looking title.
And now, you have a 3D running animation…! I hope you have learned something from this blog and give it a try yourself. It was very satisfying taking a real-life achievement and converting it to a in-depth geospatial representation. :)