Geovis Project Assignment, TMU Geography, SA8905, Fall 2025
By: Haneen Banat
Introduction
Traffic collisions are a major urban safety concern in large cities like Toronto, where dense road networks, high population, and multimodal movement create complex interactions between drivers, pedestrians, cyclists, and transit. Traditional 2D maps and tables can represent collision statistics, but they often fail to communicate spatial intensity or the “feel” of risk across neighbourhoods. For this project, I explore how GIS, 3D modeling, and architectural rendering tools can work together to reimagine collision data as a three-dimensional, design-driven geovisualization.
My project, 3D Visualization of Traffic Collision Hotspots in Toronto, transforms Toronto Police Service collision data into an immersive 3D map. The goal is to visualize where collisions are concentrated, how spatial patterns differ across neighbourhoods, and how 3D storytelling techniques can make urban safety data more intuitive and visually compelling for planners, designers, and the public. I use a multi-software workflow that spans ArcGIS Pro, the City of Toronto’s 3D massing data, SketchUp, and Lumion. This project demonstrates how cartographic tools can support modern spatial storytelling, blending urban analytics with design.
Data Sources
Toronto Police Open Data Portal
Dataset: Traffic Collisions (ASR-T-TBL-001)
Link: https://data.torontopolice.on.ca
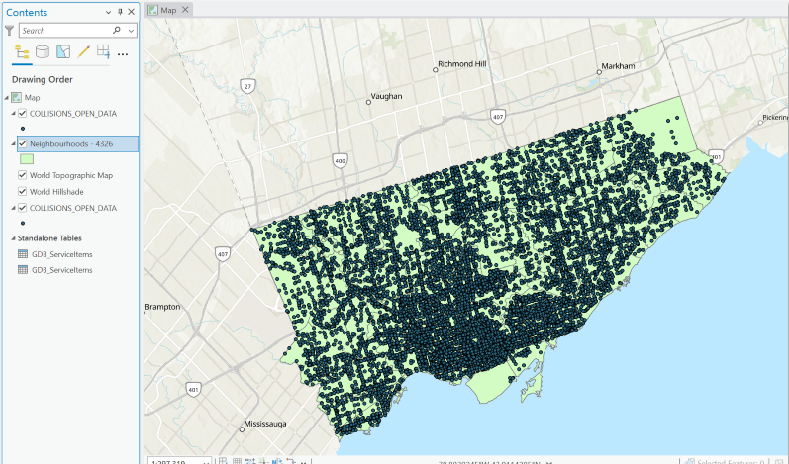
This dataset includes over 770,000 collision records across many years. Each record includes: Location, Date, time, collision type, mode invloved and different attributes. Because the full dataset is extremely large and includes COVID-period anomalies, I filtered the dataset to only the year 2022. This produced roughly 50,000-60,000 collision records. For this project, only automobile collisions were used. I downloaded the geodatabase file as a CVS.
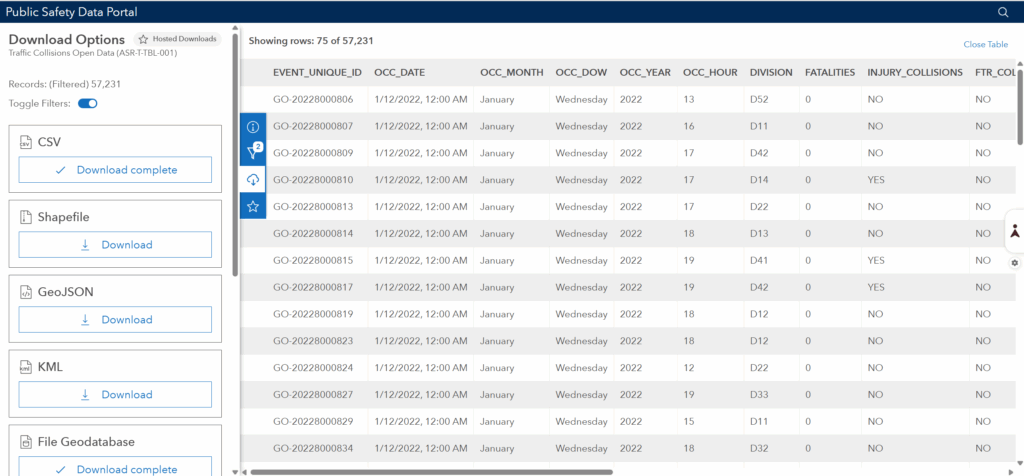
The second piece of data that was needed was City of Toronto – Neighbourhood Boundaries: Link: https://open.toronto.ca/dataset/neighbourhoods/
The third piece of data is City of Toronto Planning, 3D Massing Model. Link: https://cot-planning.maps.arcgis.com/apps/webappviewer/index.html?id=161511b3fd7943e39465f3d857389aab
This dataset includes 3D building footprints and massing geometry. I downloaded individual massing tiles in SketchUp format (.skp) for the neighbourhoods with the highest hotspot scores. Because each tile is extremely heavy, I imported them piece by piece.
Software Used:
- ArcGIS Pr: filtering, spatial join, hotspot analysis
- SketchUp: extrusion modeling and colour classification
- Lumion: 3D rendering, lighting, and final visuals
Methodology
This project required a multi-stage workflow spanning GIS analysis, CAD conversion, 3D modeling, and rendering. The workflow is divided into four main stages.
Step 1: Data Cleaning & Hotspot Analysis using ArcGIS Pro
Filtering Collision Data:
The Police dataset originally contained 772,000 records.
- Applied a filter for OCC_DATE = 2022
- Removed non-automobile collisions
- Ensured that only records with valid geometry were included
- Downloaded as File Geodatabase (shapefile download was corrupt)
After filtering, the dataset was reduced to a manageable 50,000 records
Step 2: Spatial Join (Join collisions to neighbourhoods)
To understand spatial distribution, I joined the collision points to Toronto’s 158 neighbourhood polygons
Tool: Spatial Join
- Target features: Neighbourhoods
- Join features: Collisions
- Join operation: JOIN_ONE_TO_ONE
- Match option: INTERSECT
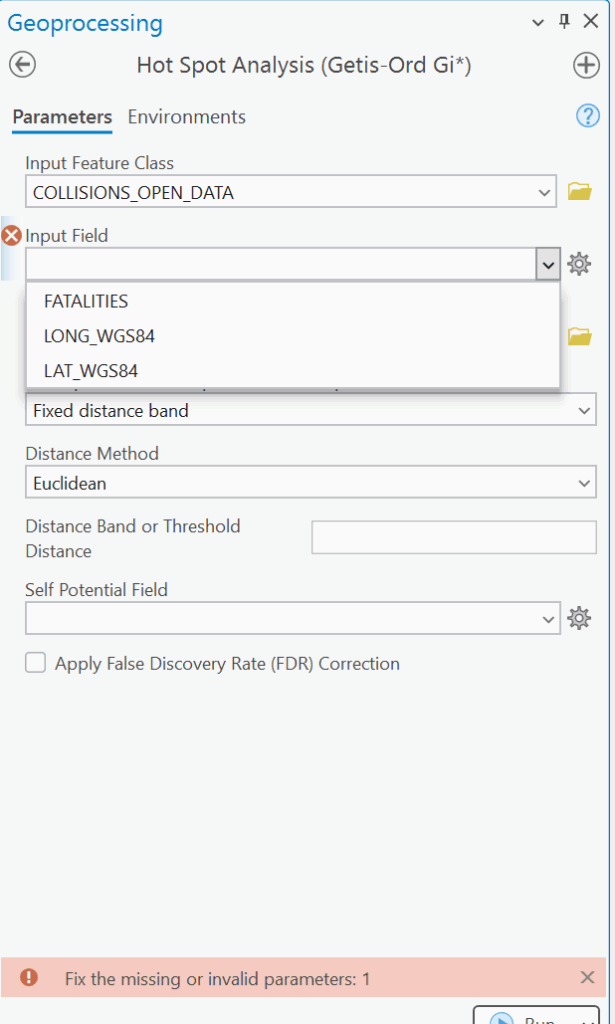
Step 3: Hotspot Analysis (Optimized Hot Spot Analysis)
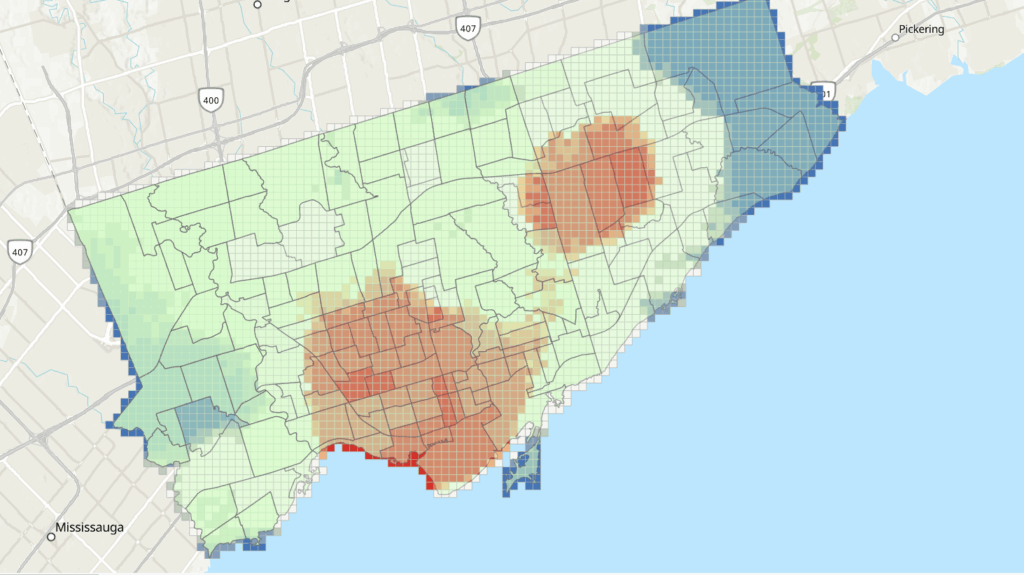
Tool: Optimized Hot Spot Analysis
Input: All collision points
This produced a statistically significant hotspot/coldspot map: White = not significant Red = High-risk clusters Blue = Low-risk clusters
Step 4: 3D Map in Sketchup
Importing DWG into SketchUp
To import into SketchUp, the downloaded SketchUp files of Toronto neighborhood boundaries that were downloaded earlier were used in this stage. Each file must be downloaded separately. Identifying each section was done through the labels that were automatically applied.
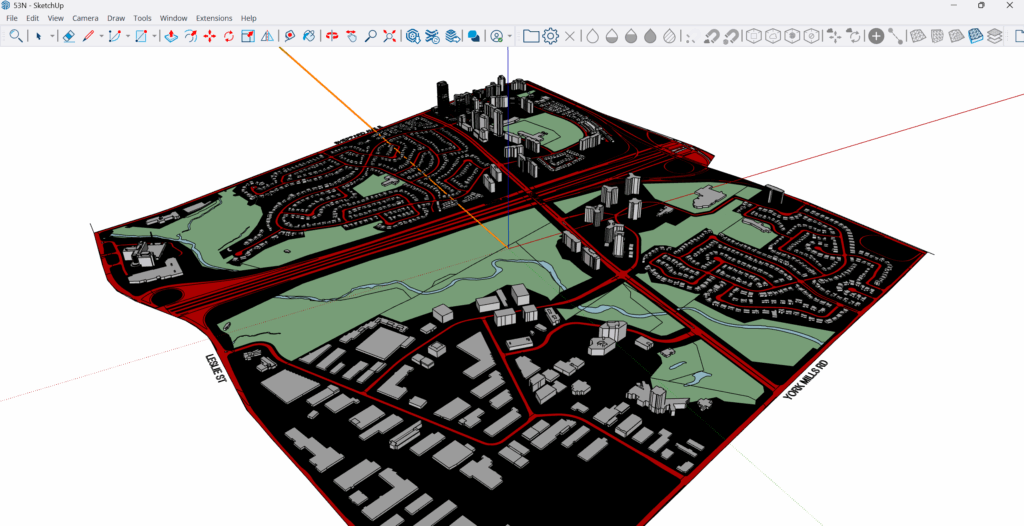
Applying Colour Classification: To create a visually intuitive gradient:
Very high hotspots: red, Low collisions: blue

Step 5: Rendering & Visualization in Lumion
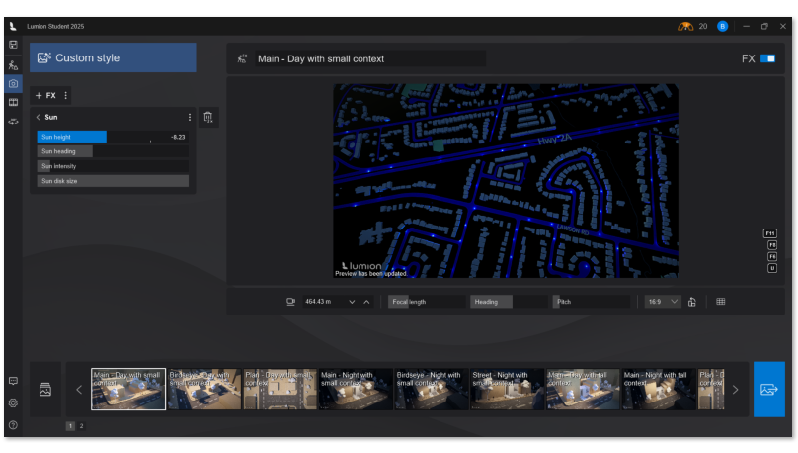
Importing the SketchUp Model: The extruded model was imported into Lumion for realistic visualization.
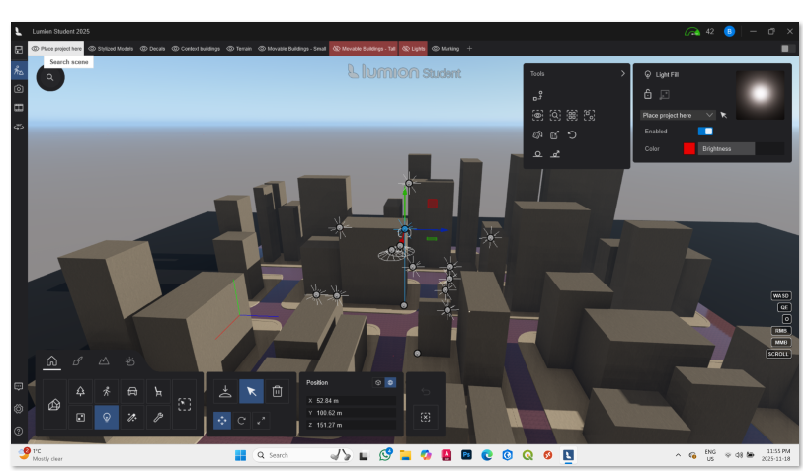
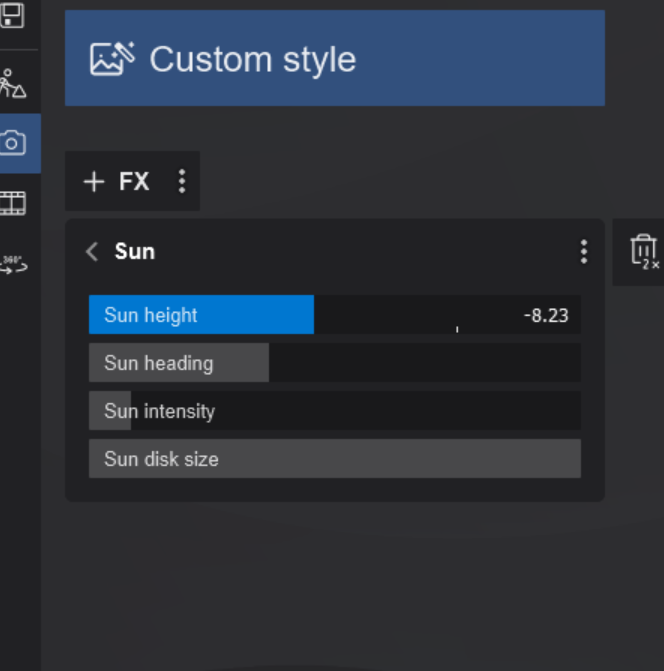
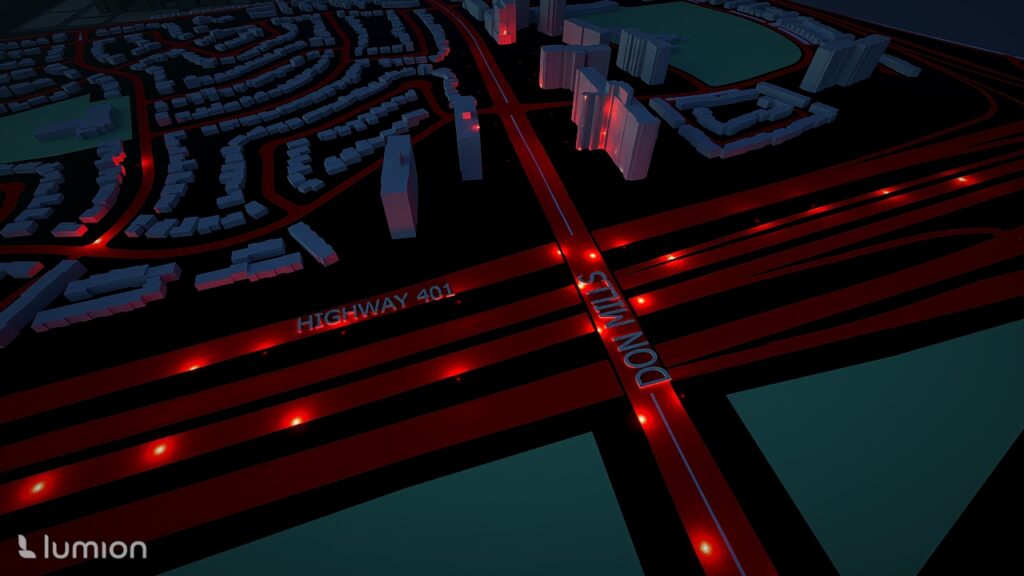
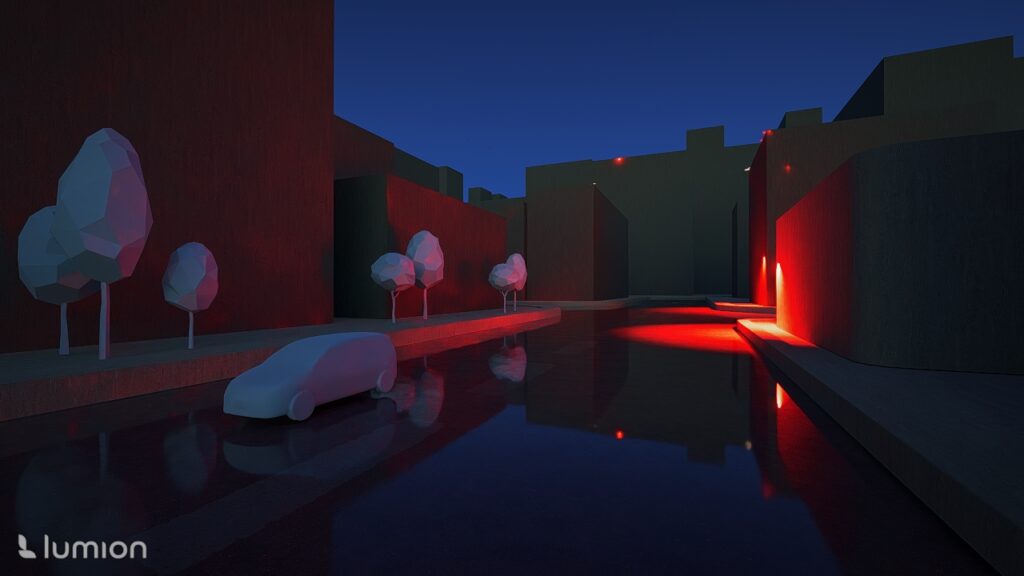
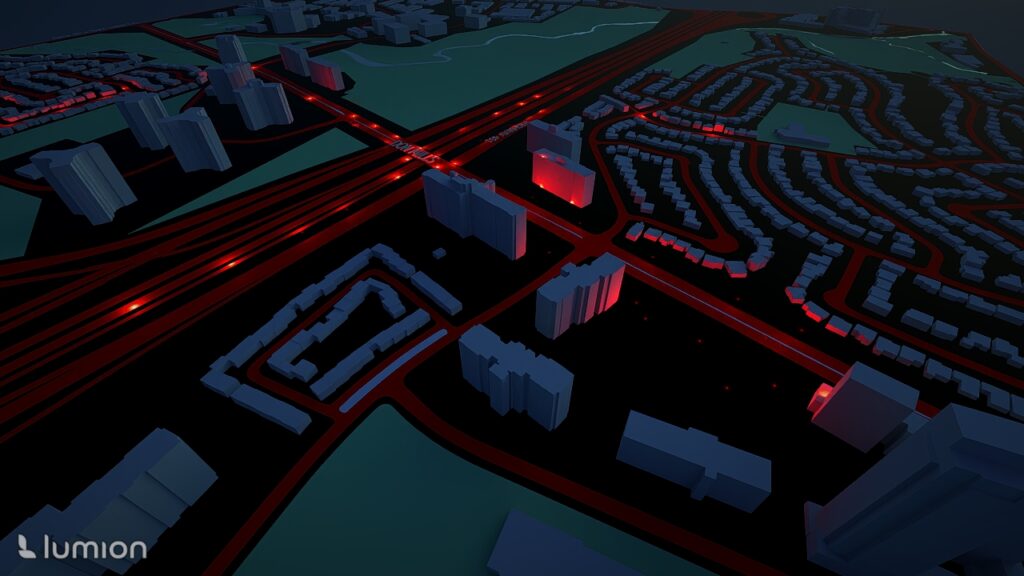
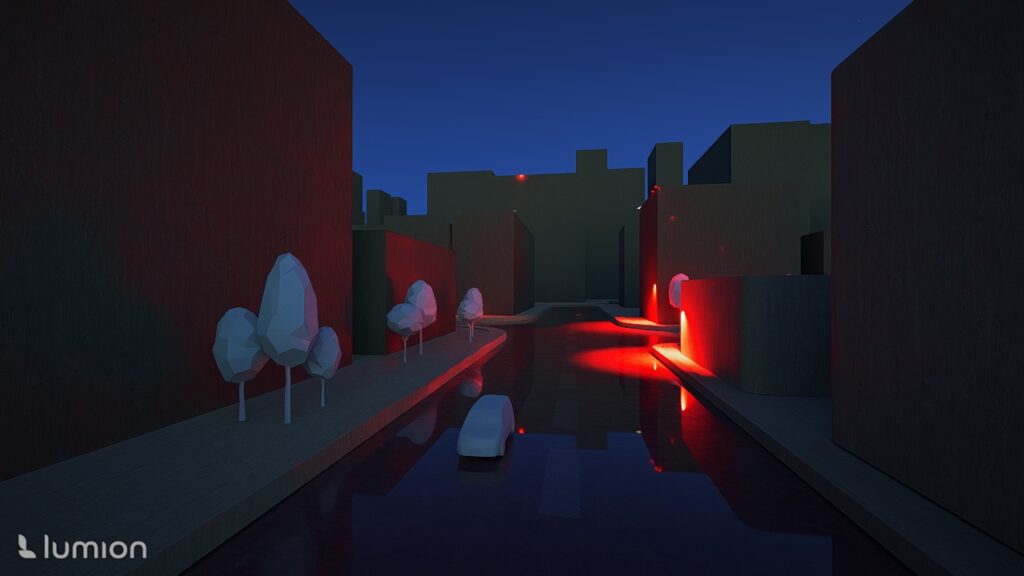
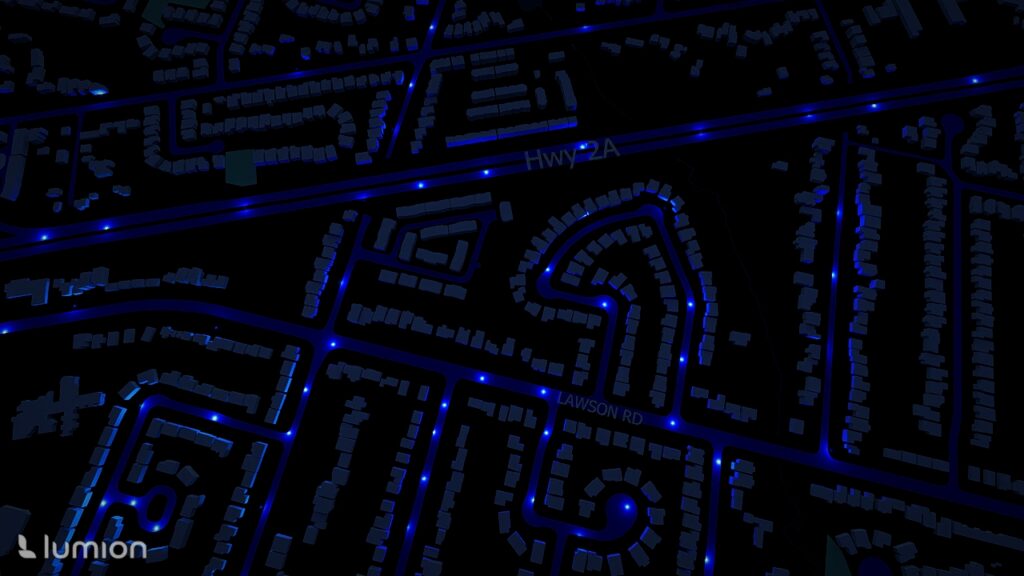
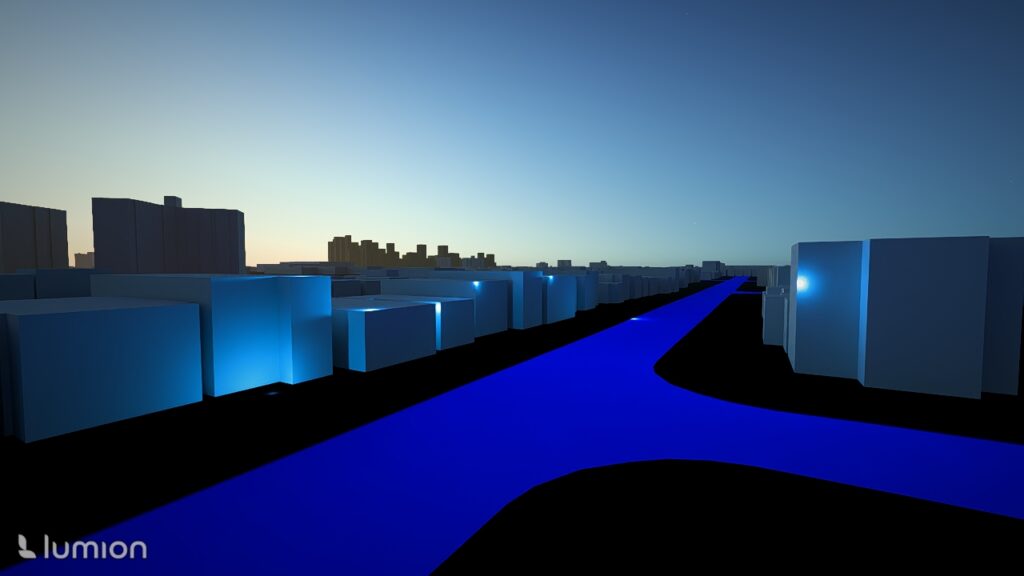
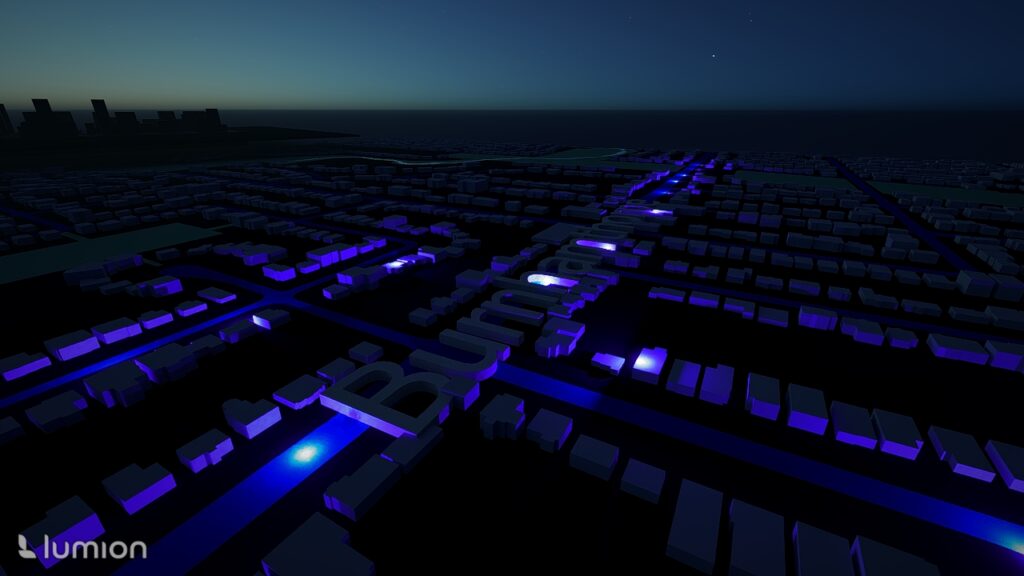
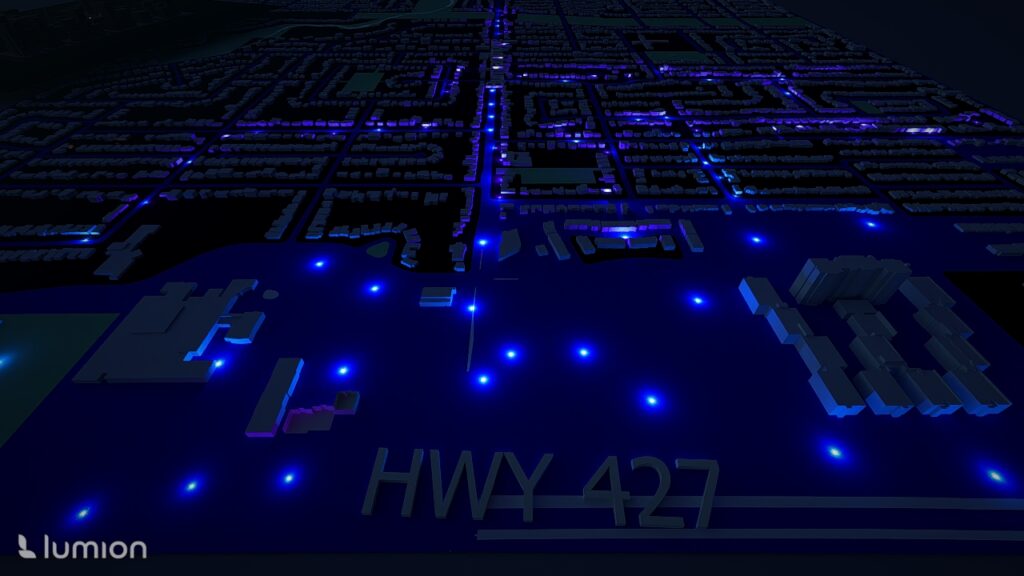
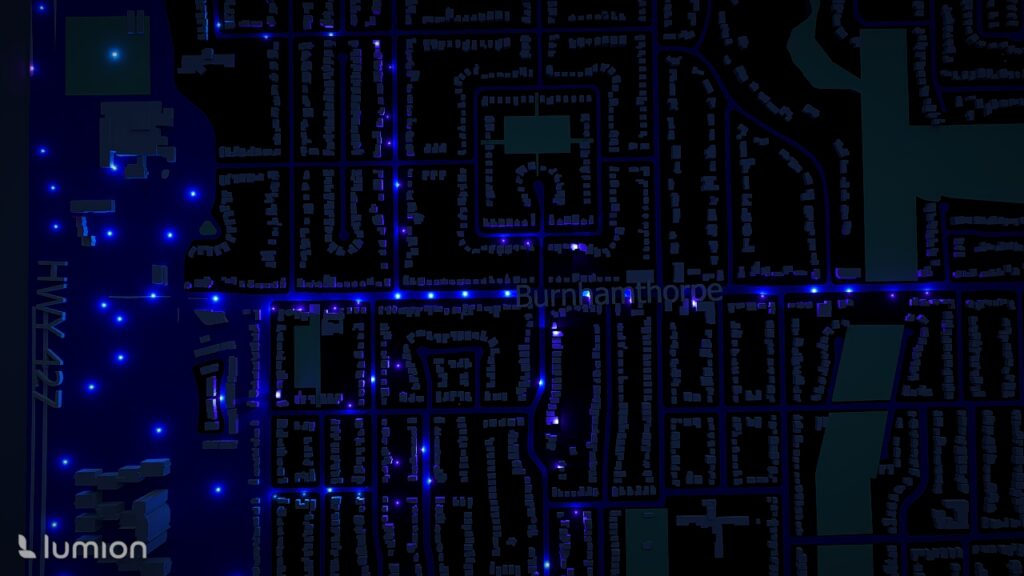
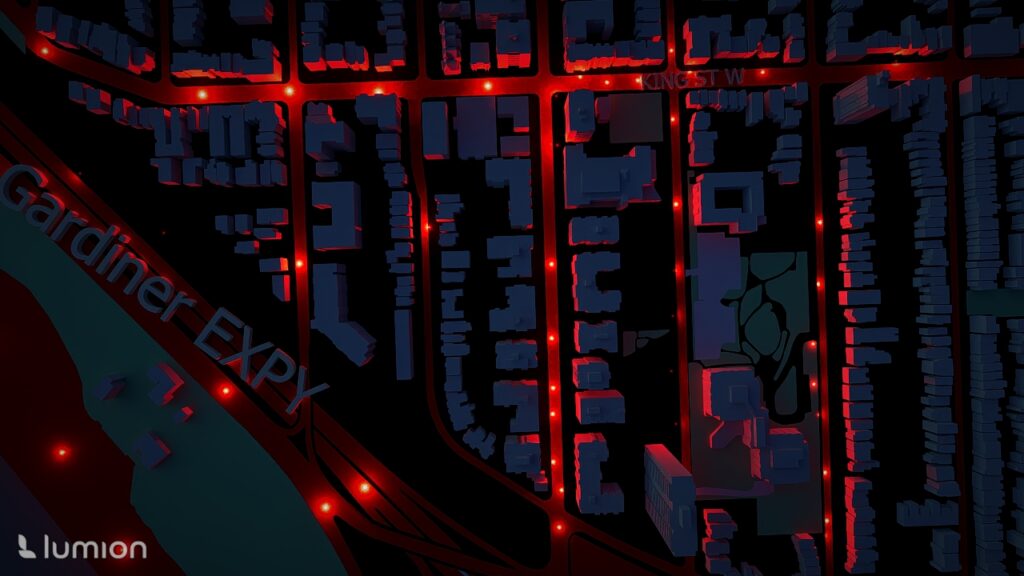
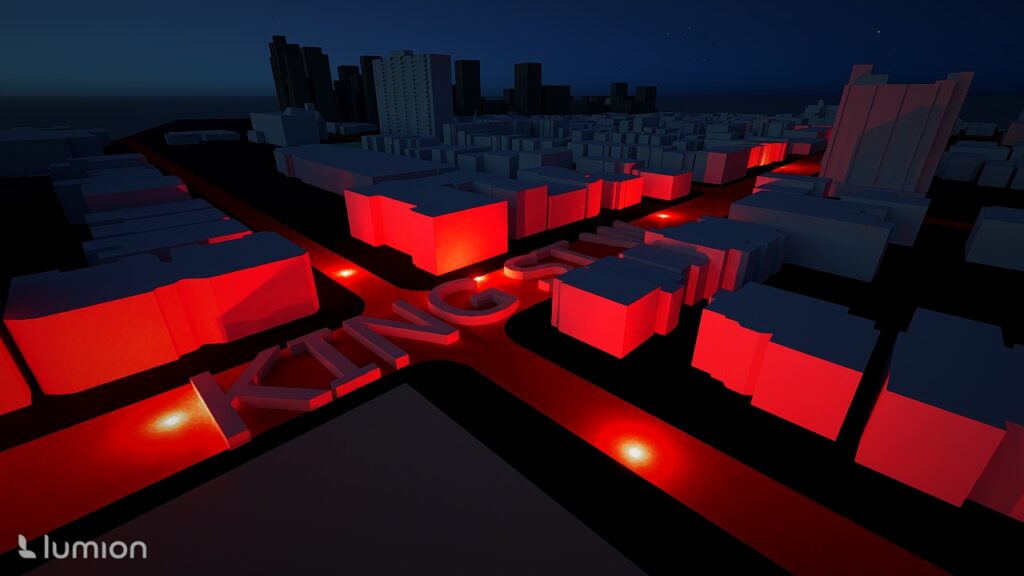
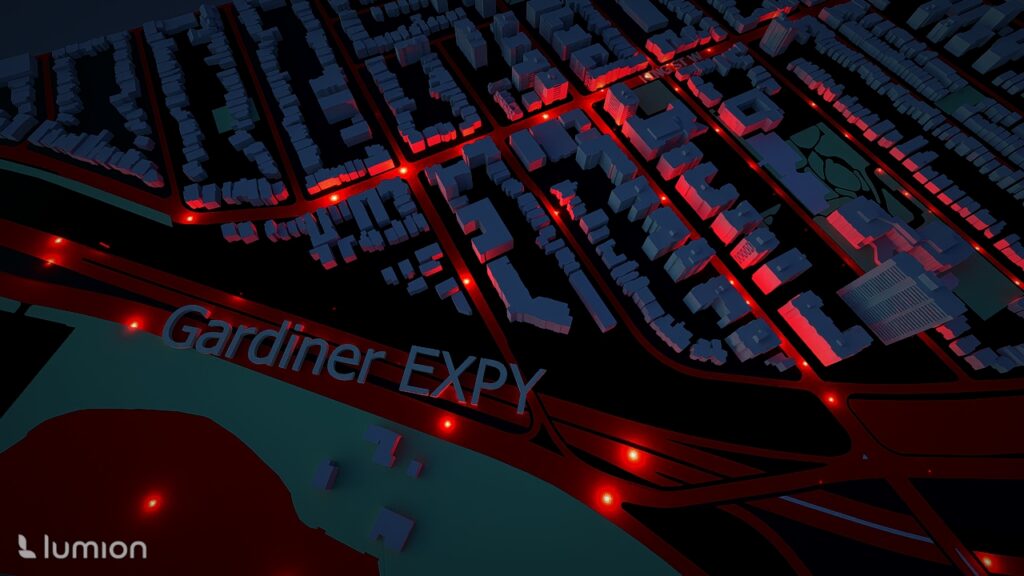
Adding Atmospheric Lighting: Because this visualization focuses on highlighting hotspot intensities, I chose a night time scene: which then i reduced sunlight intensity. Added Spotlights added at various heights Colours represented collision intensity: Blue = lower-risk area, Red = high collision zones
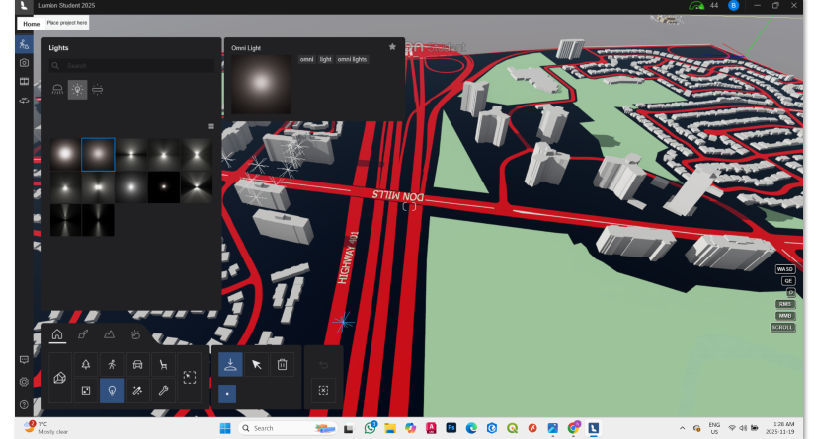
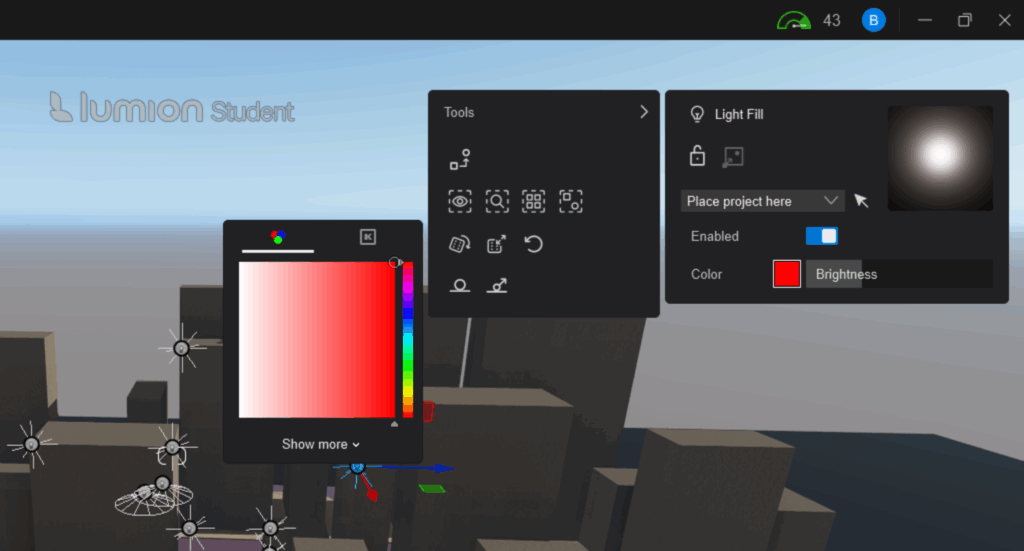
Add lighting and change color to to match the collision type
Decrease the Sun intensity to set a night time setting
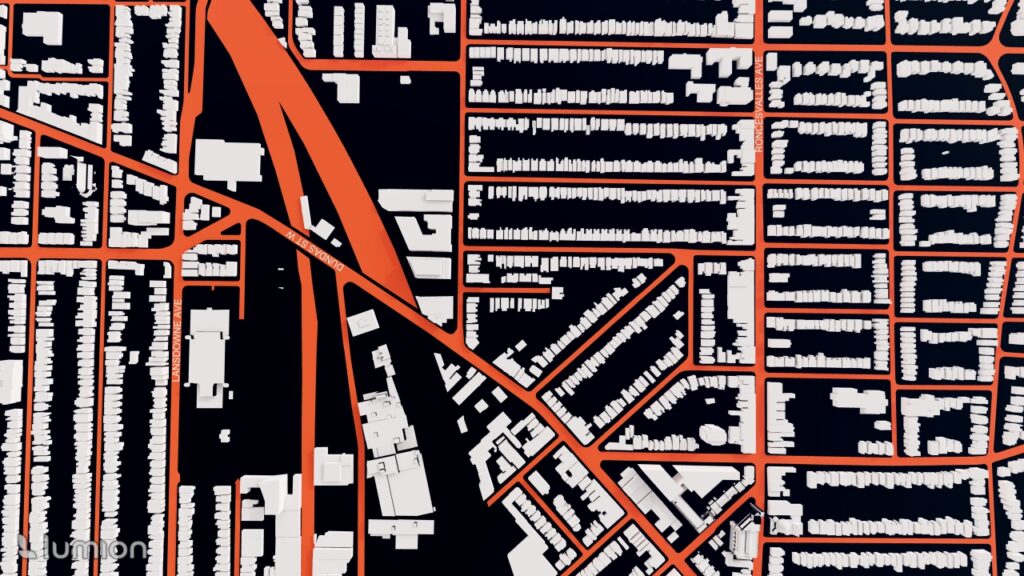
Camera Movement & Composition: I created multiple camera angles to show: Nighttime lighting reflecting collision intensity, Panoramic views of the 3D collision landscape, Close-ups of high-risk clusters
Step 6: Exporting the Final Renders
Each neighborhood would need to be rendered at the chosen angle and exported.
Results
1. Downtown and Waterfront
Areas such as St. Lawrence–East Bayfront–Islands, Harbourfront–CityPlace, Fort York–Liberty Village, and West Queen West showed extremely high collision densities
2. Inner Suburban Belt
Neighbourhoods like South Riverdale, Annex, Dufferin Grove, and Trinity-Bellwoods exhibited moderate-to-high collision intensity, correlating with high pedestrian and cyclist activity.
3. Lower-risk Zones
Coldspots appeared mainly in low-density residential neighbourhoods with fewer arterial roads.
3D Advantages
The extruded height and nighttime lighting made it easy to instantly see:
- Which areas had the most collisions
- How intensity changes across neighbourhoods
- Where the city might focus safety interventions
Limitations
- Massing data is extremely large: Importing all of Toronto was impossible due to memory and file size constraints.
Only selected hotspot tiles were used. - Temporal variation ignored: This project analyzed only 2022 and not multi-year trends.
- Hotspot analysis generalizes clustering
While statistically robust, it does not differentiate between collisions caused by traffic volume, infrastructure, or behavioural factors. - Rendering is interpretive
Height and colour were designed for visual storytelling rather than strict quantitative precision. - Limited Interactive: The 3D render isnt interactive unless you have acess to the softwares used, which would either need to be Sketchup or Lumion.
Conclusion
This project demonstrates how collision data can be transformed from static points into an immersive 3D visualization that highlights urban road safety patterns. By integrating ArcGIS analysis with architectural modeling tools like SketchUp and Lumion, I created a geographically accurate, data-driven 3D landscape of Toronto’s collision hotspots.
The final visualization shows where collisions cluster most intensely, provides intuitive spatial cues for understanding road safety risks, and showcases the potential of hybrid cartographic-design workflows. This form of neo-cartography offers a compelling way to communicate urban safety information to planners, designers, policymakers, and the public.