Geovis Project Assignment, TMU Geography, SA8905, Fall 2025
By: Danielle Lacka
INTRODUCTION:
Hello readers!
For my geo-visualization project, I wanted to weave together stories of land, knowledge, and technology through a Métis lens. My project, “Mapping Métis Traditional Ecological Knowledge (TEK): Where TEK Plant Species Are Found in the Carolinian Zone,” became a way to visualize how cultural knowledge and ecology intersect across southern Ontario’s most biodiverse landscape.
Inspired by the storytelling traditions that shape how knowledge is shared, I used ArcGIS StoryMaps to build an interactive narrative that brings TEK plant species to life on the map.
This project is more than just a map—it’s a story about connection, care, and the living relationships between people and the environment. Through digital tools and mapping in ArcGIS Pro, I aimed to highlight how Métis TEK continues to grow and adapt in today’s technological world.
See the finished story map here:
Join me as I walk through how I created this project where data meets story, and where land, plants, and knowledge come together on the screen.
PROJECT BACKGROUND:
In 2010, the Métis Nation of Ontario (MNO) released the Southern Ontario Métis Traditional Plant Use Study, the first of its kind to document Métis traditional ecological knowledge (TEK) related to plant and vegetation use in southern Ontario (Métis Nation of Ontario, 2010). The study, supported by Ontario Power Generation (OPG), was developed through collaboration with Métis Elders, traditional resource users, and community councils in the Northumberland, Oshawa, and Durham regions. It highlights Métis-specific traditional and medicinal practices that differ from those of neighbouring First Nations, while also recording environmental changes in southern Ontario and their effects on Métis relationships with plant life.
Since there are already extensive records documenting the plant species found across the Carolinian Zone, this project focuses on connecting those existing data sources with Métis Traditional Ecological Knowledge, revealing where cultural and ecological landscapes overlap and how they continue to shape our understanding of place. Not all species mentioned in the study are included in this storymap as some species mentioned were not found in the Carolinian Zone List of Vascular Plants by Michael J. Oldham. The video found at the end of this story is shared by the Métis Nation of Ontario as part of the Southern Ontario Métis Traditional Plant Use Study (2010). It is included to support the geovisualization of plant knowledge and landscapes in southern Ontario. The teachings and knowledge remain the intellectual and cultural property of the Métis Nation of Ontario and are presented with respect for community protocols, including acknowledging the Métis Nation of Ontario as the knowledge holders, not reproducing or claiming the teachings, and using them solely for the purposes of geovisualization and awareness in this project.
This foundational research of the MNO represents an important step in recognizing and protecting Métis ecological knowledge and cultural practices, ensuring they are considered in environmental assessments and future land-use decisions. Visualizing this knowledge on a map helps bring these relationships to life and helps in connecting traditional teachings to place, showing how Métis plant use patterns are tied to specific landscapes, and making this knowledge accessible in a meaningful, spatial way.
Let’s get started on how this project was built.
THE GEOVISUALIZATION PRODUCT:
The data that was used to build this StoryMap is as follows:
- Statistics Canada CD boundary shapefile
- The Ontario Geohubs EcoRegions Boundary Shapefile
- Map of Carolinian Zone with eco districts by Michael J Oldham
- Métis Nation of Ontario – Southern Ontario Métis Traditional Plant Use Study
- List of the Vascular Plants of Ontario by Michael J Oldham
The software that was used to create this StoryMap is as follows:
- ArcGIS StoryMaps to put the story together
- ArcGIS Pro to build the map for the story
- Microsoft Excel to build the dataset
Now that we have all the tools and data we need we can get started on building the project.
STEPS:
- Make your dataset: we have 2 sets of data and it is easier when everything is in one place. This requires some manual labour of reading and searching the data to find out what plants mentioned in the MNO’s study are found within the Carolinian zone and what census divisions they could *commonly be found in.
*NOTE: I made this project based on the definition of status common to be found in the Carolinian zone and CDs as there were many different status definitions in Oldham’s data, but I wanted to connect these datasets based on the definition of being commonly found instead of other definitions (rare, uncommon, no status, etc.) (Oldham, 2017).
In order to make this new dataset I used Excel to hold the columns: Plant Name, Scientific Name, Comments, and Métis use of description from the MNO’s study, as well as a column called “Common Status” to hold the CDs these species were commonly found in.
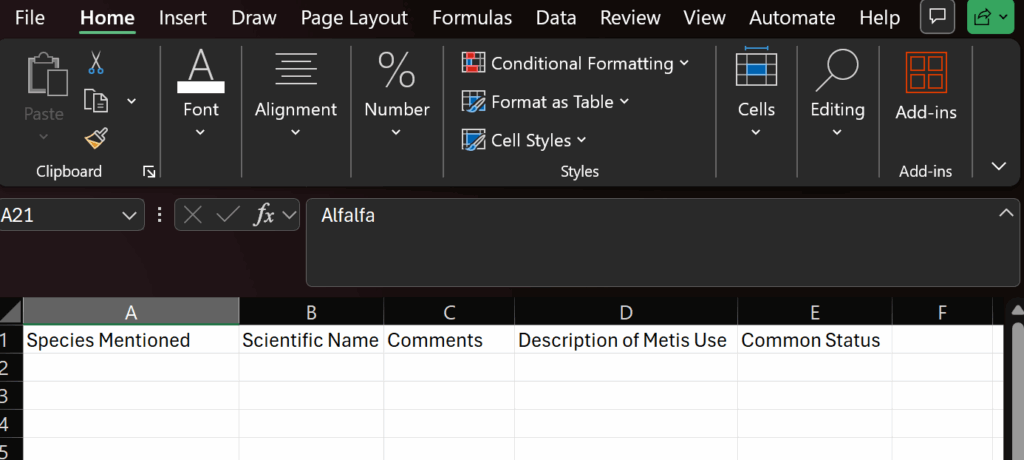
- Fill your dataset: Now that the dataset is set up, data can be put into it. I brought the list of species as well as the rest of the columns mentioned from the MNO’s plant use study into their respective columns:
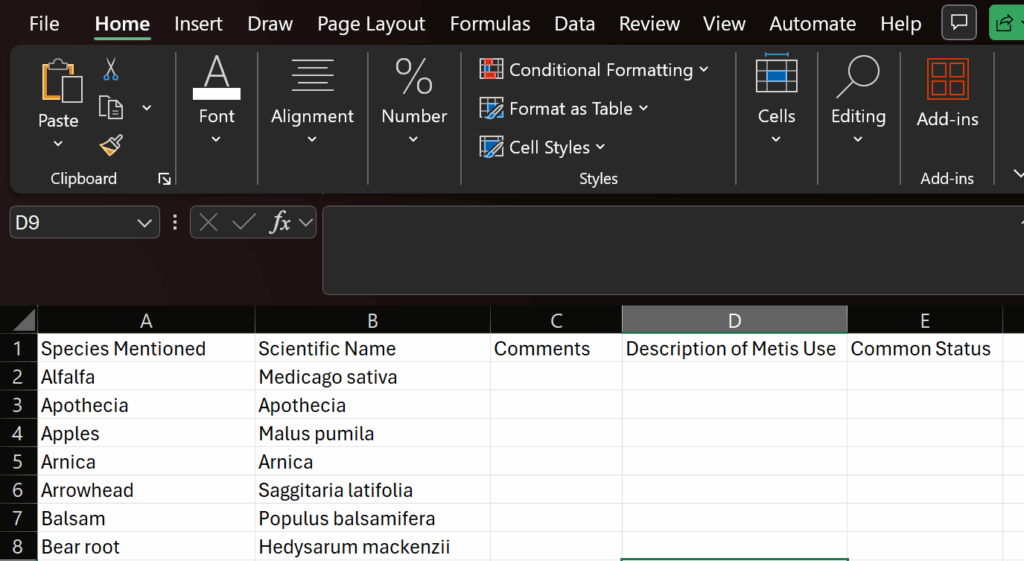
I included the comments column as this is important context to include to ensure that using this data was in its whole and told the whole story of this dataset rather than bits and pieces.
Once the base data is in the sheet we can start locating their common status within the Carolinian zone using Oldham’s data records.
What I did was search each species mentioned in the MNO plant use study within Oldham’s dataset. Then if the species matched records in the dataset I would include the CD’s name in the Common Status column.
Once the entire species list has been searched the data collection step is complete and we can move onto the next step.
- Bring in your map layers: Open ArcGIS Pro and create a new project. I changed my basemap layer to better match the theme of this to Imagery Hybrid. Add in the Ontario Geohub Shapefile (the red outline). Rename this if you want as it is pretty well named already. Next bring in the Stats Canada CD shapefile.
- Refine your map layers: First I selected only 7E (The Carolinian Zone), using the select by attribute option:

Then you filter based on this ecoregion:

Then once you run the selection you can export as a new layer with only the Carolinian Zone.
Next I applied the CD layer and clipped it to the exported Carolinian zone layer using the clip feature:
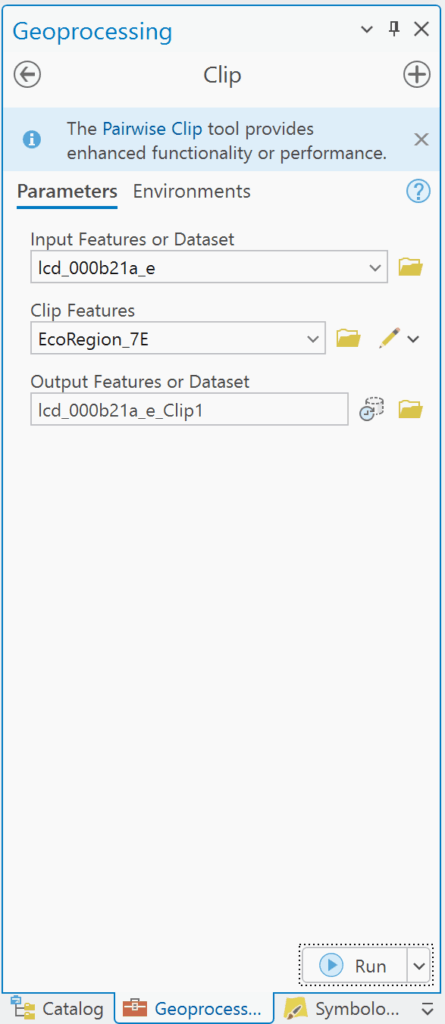
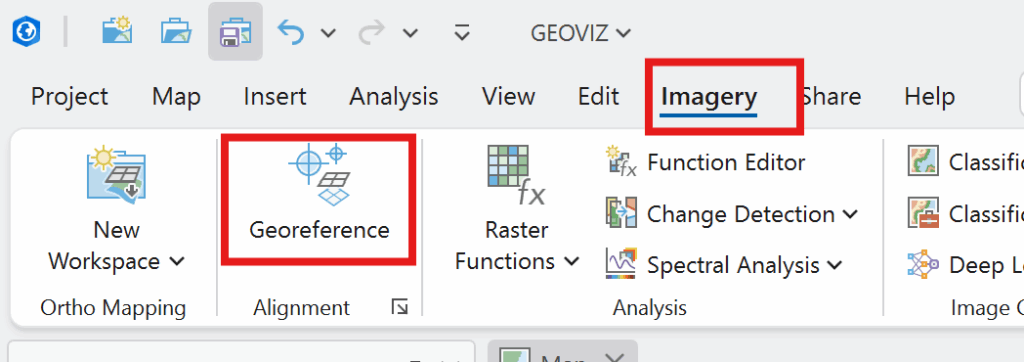
This will only show the CDs that lie within the Carolinian Zone. Now you will add the pdf layer. We need to use this pdf to draw the boundary line for 7E4 which is an eco-district that includes several CDs. With the pdf layer selected, click Imagery and Georeference:
Next, you can right click on the layer and click zoom to layer.

Then in the georeferencing tab, click move and the pdf should show up to move around the map.

Now, you can use the three options (in the figure above) to as best you can overlay the pdf to align with the map to look something like this:

Once it is fit you can draw the boundary line on the clipped CD layer with create layer

If it is too tricky to see beyond the pdf you can change the transparency to make it easier:

Now you can draw the boundary. Once that is complete click save, then export the layer drawn as a new layer. Now you can change the symbology for colour to show the distinctive divisions in the Ecozone.
For the labels, I added a new column in the Eco-divisions layer called Short for the abbreviations of the districts for a better look. I manually entered in the abbreviations for the CDs similar to how Oldham did it in his map.
Now you should have something like this:

Now that the map is completed, we can start on making the storymap.
- Make the storymap
I started by writing up the text for how I wanted the story map to flow in google docs, making an introduction and providing some background context: such as the data I used, why the work done by the MNO is important for Indigenous people and the environment, and what I hope the project achieves. I wrote up where I wanted to put the maps, and what images and plant knowledge tables.
I applied this plan to the story map and had to turn the map I made in ArcGIS into a web map in order to access it in story map. (You can choose to make the map in ArcGIS Online to avoid this).
I also found some awesome 3-D models of some of the species mentioned from a site called Sketch fab which I thought was super cool to be able to visualize!
Then you have created a story map learning about the Carolinian Zone and what Métis TEK plant species are commonly found and used from here!
CONCLUSIONS/LIMITATIONS:
One of the key limitations of this project is that some zones lacked common status plant species as described in the MNO Plant Use Study, resulting in no species being listed for those areas. This absence may reflect gaps in documentation rather than a true lack of plant use, pointing to the need for more comprehensive and localized research.
The uneven distribution of documented plant species across zones underscores both the complexity of Métis plant relationships and the urgency of further study. By embracing these limitations as a call to action, we affirm the value of Indigenous knowledge systems and encourage broader learning about the interdependence between people and place.
REFERENCES
Carolinian Canada Coalition. (2007). Caring for nature in Brant: Landowner action in Carolinian Canada [Fact sheet]. https://caroliniancanada.ca/sites/default/files/File%20Depository/Library/factsheets/Brant_Factsheet_Final.pdf
Carolinian Canada Coalition. (2007). Caring for nature in Elgin: Landowner action in Carolinian Canada [Fact sheet]. https://caroliniancanada.ca/sites/default/files/File%20Depository/Library/factsheets/Elgin_Factsheet_Final.pdf
Carolinian Canada Coalition. (2007). Caring for nature in Essex: Landowner action in Carolinian Canada [Fact sheet]. https://caroliniancanada.ca/sites/default/files/File%20Depository/Library/factsheets/Essex_Factsheet_Final.pdf
Carolinian Canada Coalition. (2007). Caring for nature in Haldimand: Landowner action in Carolinian Canada [Fact sheet]. https://caroliniancanada.ca/sites/default/files/File%20Depository/Library/factsheets/Haldimand_Factsheet_Final.pdf
Carolinian Canada Coalition. (2007). Caring for nature in Hamilton: Landowner action in Carolinian Canada [Fact sheet]. https://caroliniancanada.ca/sites/default/files/File%20Depository/Library/factsheets/Hamilton_Factsheet_Final.pdf
Carolinian Canada Coalition. (2007). Caring for nature in Lambton: Landowner action in Carolinian Canada [Fact sheet]. https://caroliniancanada.ca/sites/default/files/File%20Depository/Library/factsheets/Lambton_Factsheet_Final.pdf
Carolinian Canada Coalition. (2007). Caring for nature in Middlesex: Landowner action in Carolinian Canada [Fact sheet]. https://caroliniancanada.ca/sites/default/files/File%20Depository/Library/factsheets/Middlesex_Factsheet_Final.pdf
Carolinian Canada Coalition. (2007). Caring for nature in Niagara: Landowner action in Carolinian Canada [Fact sheet]. https://caroliniancanada.ca/sites/default/files/File%20Depository/Library/factsheets/Niagara_Factsheet_Final.pdf
Carolinian Canada Coalition. (2007). Caring for nature in Oxford: Landowner action in Carolinian Canada [Fact sheet]. https://caroliniancanada.ca/sites/default/files/File%20Depository/Library/factsheets/Oxford_Factsheet_Final.pdf
Chatham-Kent Home. (2024, November 28). Agriculture & Agri-Food. https://www.chatham-kent.ca/EconomicDevelopment/invest/invest/Pages/Agriculture.aspx
Métis Nation of Ontario. (2010). Traditional ecological knowledge study: Southern Ontario Métis traditional plant use [PDF]. Métis Nation of Ontario. https://www.metisnation.org/wp-content/uploads/2011/03/so_on_tek_darlington_report.pdf
Oldham, Michael. (2017). List of the Vascular Plants of Ontario’s Carolinian Zone (Ecoregion 7E). Carolinian Canada. 10.13140/RG.2.2.34637.33764.